TradFi Copy Trading Core Logic
The TradFi copy trading mechanism replicates trades based on the proportion of total assets. Calculation formulas are as follows.
- Opening Position: Copier Order Size (Lots) = Copier's Account Equity / (Lead Trader's Account Equity + Lead Trader Trading Fee) × Lead Trader Order Size (Lots)
- Partial Closing: Copier Partial Close Size (Lots) = Lead Trader Close Size (Lots) / Total Size of Lead Position (Lots) × Total Size of Copy Position (Lots)
- Full Closing: The copier follows the lead trader to close the position at market price.
Examples
Opening Position
The TradFi lead trader has 10,000 in account assets and opens a 1-lot position with a fee of 6. After execution, the lead trader's account equity becomes 9,994. The copy trader has 5,000 in account assets.
Copier Order Size = 5,000 / (9,994 + 6) × 1 = 0.5 Lots
Partial Closing
The lead trader holds 1 lot and partially closes 0.2 lots. The copy trader holds 0.5 lots.
Copier Order Size = 0.2 / 1 × 0.5 = 0.1 Lots
Full Closing
If the lead trader fully closes a position, the copier will also fully close the corresponding copied position.
Special Scenarios
Due to minimum order size limits:
• If the minimum order size is 0.01 lot and the calculated size is 1.111, the system rounds down to 1.11 lots;
• If the minimum order size is 0.1 lot and the calculated size is 1.111, the system rounds down to 1.1 lots;
• If the minimum order size is 1 lot and the calculated size is 1.111, the system rounds down to 1 lot.
Due to maximum order size limits:
• If the maximum order size is 10 lots and the calculated size is 20 lots, the system will cap it at 10 lots.
TradFi Profit Sharing Logic
As a Gate TradFi lead trader, you can earn a percentage of the net profits generated by copiers based on the High-Water Mark (HWM) principle.
Profit Sharing Mechanism: High-Water Mark (HWM)
• Profit sharing is based on the copier's cumulative net PnL within the trading period (realized + unrealized);
• Profit sharing is only triggered when the copier's cumulative net PnL exceeds the previous record high;
• If losses occur, the lead trader must fully recover the losses before becoming eligible for profit sharing again;
• A new HWM is only set when the cumulative net PnL surpasses the previous peak, ensuring lead traders are only rewarded when consistent profits are generated.
Calculation Logic
• Cumulative Net PnL (Within the Cycle)= Total Realized PnL + Total Unrealized PnL – Cumulative Fees + Cumulative Funding Fees + Dividends
• Eligible PnL for Sharing =Cumulative Net PnL Within the Cycle – High-Water Mark at Last Profit Sharing
• Profit sharing is only calculated when the eligible profit is > 0
• Profit Sharing Amount (per Copier) = Eligible PnL × Profit Sharing Ratio
• Total profit sharing is calculated as the sum of all copiers' profit sharing amounts under the lead trader.
Example
| Copier | Week 1 | Week 2 | Week 3 | Week 4 | Week 5 | ... |
|---|---|---|---|---|---|---|
| Realized PnL | 100 | 200 | 200 | 300 | 400 | |
| Unrealized PnL | 100 | -300 | 100 | -100 | 200 | |
| Cumulative Net PnL | 200 | -100 | 300 | 200 | 600 | |
| Latest High-Water Mark | 0 | 200 | 200 | 300 | 300 | |
| Eligible Profit | 200 | 0 | 100 | 0 | 300 | |
| Profit Sharing Ratio | 10% | 10% | 10% | 10% | 10% | |
| Profit Sharing Amount | 20 | 0 | 10 | 0 | 30 |
TradFi Core Metrics
PnL
-
Formula
PnL = Ending Assets – Total Deposits During Period + Total Withdrawals During Period – Beginning Assets -
Example:
If current assets = 150, assets 7 days ago = 100, cumulative deposits = 20, and cumulative withdrawals = 10:
7D PnL = 150 – 20 + 10 – 100 = 40
ROI
-
Formula
-
Formula
ROI = (Ending Assets – Total Deposits During Period + Total Withdrawals During Period – Beginning Assets) / (Beginning Assets + Total Deposits During Period) -
Example:
If current assets = 150, assets 7 days ago = 100, cumulative deposits = 20, and cumulative withdrawals = 10:
7D ROI = (150 – 20 + 10 – 100) / (100 + 20) = 33.33%
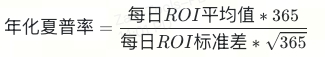
Sharpe Ratio
- Formula
Maximum Drawdown (MDD)
-
Formula
-
Formula
MDD = Max[(Historical Peak ROI – current ROI) / (Historical Peak ROI + 1)] -
7D Max Drawdown Example
The maximum drawdown calculated at 00:00 on June 8 uses the ROI at that time as the starting point and evaluates drawdowns from June 1 to June 8.
| Date | ROI | Peak | Drawdown | Max Drawdown |
|---|---|---|---|---|
| 2023-6-8 | 70.00% | 100.00% | 15.00% | - |
| 2023-6-7 | 20.00% | 100.00% | 40.00% | - |
| 2023-6-6 | 55.00% | 100.00% | 22.50% | - |
| 2023-6-5 | 7.00% | 100.00% | 46.50% | - |
| 2023-6-4 | 0.00% | 100.00% | 50.00% | 50.00% |
| 2023-6-3 | 8.00% | 100.00% | 46.00% | - |
| 2023-6-2 | 100.00% | 100.00% | 0.00% | - |
| 2023-6-1 | 75.00% | 75.00% | 0.00% | - |
Disclaimer
The content provided herein is for reference and educational purposes only and does not constitute any financial, investment, trading, or legal advice, nor does it constitute an offer or solicitation to buy or sell any digital assets. Gate makes no express or implied representations or warranties regarding the accuracy, completeness, or timeliness of the information contained herein. Product features, interfaces, rules, and fee structures may be updated or adjusted at any time. Please refer to the latest announcements and the actual information displayed on the Gate platform for the most accurate details.
Digital asset investments involve significant risk, and prices may fluctuate substantially. You may lose the entire amount of your investment. Please make decisions cautiously based on your own financial situation and risk tolerance after fully understanding the associated risks. If necessary, you are advised to consult an independent professional financial or legal advisor.
For more information about potential risks, please refer to Gate's Risk Disclosure and User Agreement.
