À medida que os mercados de criptomoedas se consolidaram como ambientes de negociação altamente voláteis e ininterruptos, interpretar movimentos de preço de curto prazo tornou-se cada vez mais complexo. O momento e os osciladores enfrentam esse desafio ao medir a velocidade e a intensidade das mudanças de preço, revelando se a força de um ativo está se acumulando ou se dissipando. Ao converter a ação bruta dos preços em sinais estruturados de momento, esses indicadores ajudam a identificar possíveis pontos de inflexão que nem sempre são visíveis nos gráficos. Hoje, eles ocupam uma posição central na análise técnica, oferecendo uma maneira mais sistemática de avaliar o comportamento do mercado em conjunto com outras ferramentas analíticas.
O que são osciladores
Os osciladores não são indicadores que acompanham a direção dos preços ao longo do tempo; são indicadores que medem a rapidez com que o preço está mudando.
Em vez de seguir tendências sustentadas, os osciladores concentram-se na velocidade do movimento do preço, destacando mudanças no momento em vez de confirmar a direção de longo prazo. Essa diferença os torna mais adequados para identificar possíveis reversões do que para validar tendências em andamento.
Eles não se movem livremente com o preço; em vez disso, operam dentro de intervalos fixos, como 0 a 100 ou -1 a 1. Essa estrutura limitada permite que os traders reconheçam extremos no sentimento do mercado. À medida que o momento acelera ou enfraquece, os osciladores se ajustam, muitas vezes sinalizando mudanças antes que se tornem claramente visíveis na ação do preço.
Como os osciladores geram sinais de compra e venda
Os osciladores geram sinais comparando movimentos recentes de preço com faixas históricas. Esses sinais não são previsões, e sim indicações de mudança de momento.
Mecanismos comuns de sinal incluem:
-
Cruzamento de níveis limite Quando um oscilador ultrapassa níveis predefinidos, pode indicar uma alteração nas condições do mercado.
-
Divergência do preço Se o preço continua subindo enquanto o oscilador enfraquece, pode sinalizar uma possível reversão.
-
Cruzamentos da linha central Alguns osciladores usam um ponto médio (como 50 ou 0) para indicar mudanças de momento altista ou baixista.
Esses sinais são mais eficazes quando combinados com contexto, como níveis de suporte e resistência ou a estrutura geral do mercado.
Principais tipos de osciladores
Existem vários osciladores amplamente utilizados, cada um projetado para medir o momento de maneiras ligeiramente diferentes.
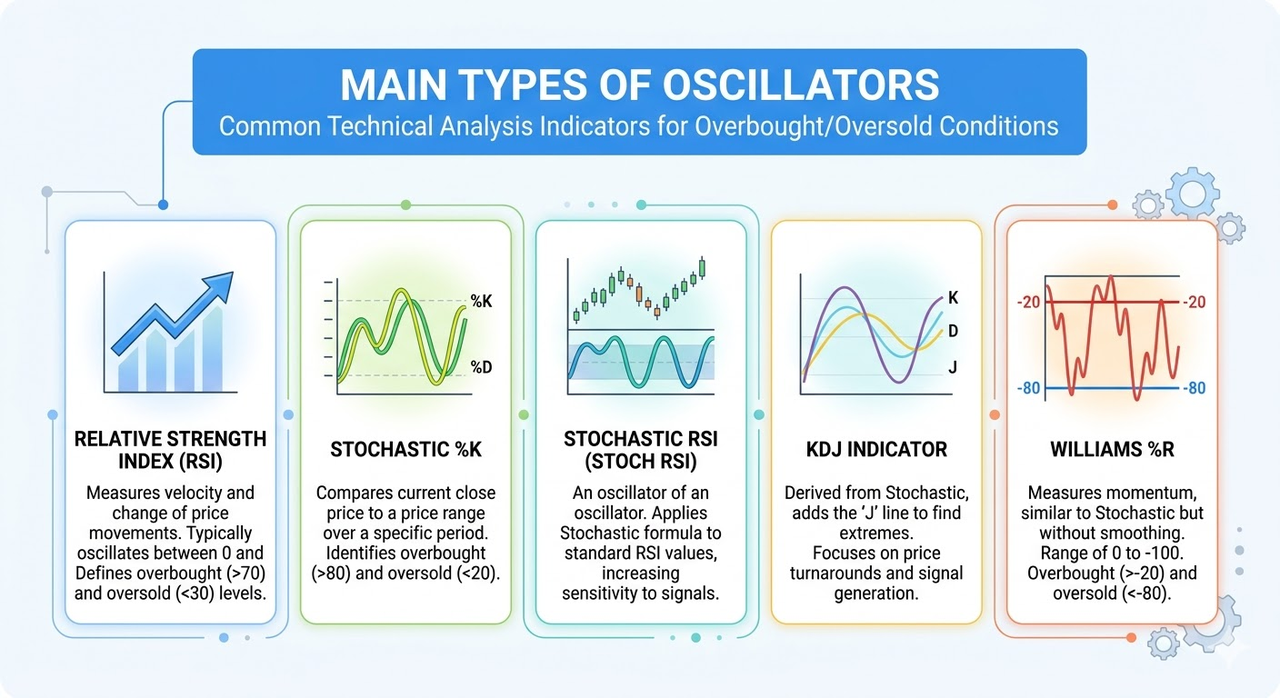
Índice de Força Relativa (RSI) Mede a velocidade e a magnitude das mudanças recentes de preço dentro de um intervalo de 0 a 100. É usado principalmente para identificar condições de sobrecompra e sobrevenda e avaliar a força geral do momento.
Stochastic %K Representa a linha central do oscilador estocástico, comparando o preço de fechamento atual com sua faixa de preço recente. Reage rapidamente às mudanças de preço, sendo útil para detecção de sinais de curto prazo.
Stoch RSI Fast
Stoch RSI Fast é uma versão mais sensível do Stochastic RSI que aplica a fórmula estocástica aos valores do RSI em vez do preço. Como reage rapidamente às mudanças no RSI, geralmente gera sinais mais rápidos e frequentes do que o RSI padrão, especialmente em mercados de cripto em movimento acelerado.
Indicador KDJ Uma extensão do oscilador estocástico que inclui uma linha “J” adicional. Esse componente extra amplifica os sinais de momento e pode destacar possíveis pontos de inflexão mais cedo, embora também possa aumentar o ruído.
Williams %R Mede a posição do preço de fechamento em relação ao intervalo de máxima e mínima ao longo de um período definido, geralmente escalado de 0 a -100. É comumente usado para identificar níveis de sobrecompra e sobrevenda, de forma semelhante aos indicadores estocásticos.
| Oscilador |
Medição principal |
Intervalo |
Sensibilidade |
Uso típico |
| Índice de Força Relativa (RSI) |
Velocidade e magnitude das mudanças de preço |
0 a 100 |
Moderada |
Identificar condições de sobrecompra/sobrevenda e força geral do momento |
| Stochastic %K |
Preço de fechamento em relação ao intervalo recente de máxima e mínima |
0 a 100 |
Alta |
Sinais de curto prazo e mudanças rápidas de momento |
| Stochastic RSI (Stoch RSI) |
Valores do RSI processados pela fórmula estocástica |
0 a 100 |
Muito Alta |
Detecção de sinais frequentes em mercados voláteis |
| Indicador KDJ |
Estocástico estendido com linha “J” adicional |
Tipicamente 0 a 100 (J pode exceder) |
Muito Alta |
Pontos de inflexão precoces, embora com maior ruído |
| Williams %R |
Posição do preço de fechamento dentro do intervalo recente |
0 a -100 |
Alta |
Detecção de sobrecompra/sobrevenda semelhante ao estocástico |
Cada um desses osciladores captura um aspecto diferente do comportamento do momento. Por isso, os traders costumam combinar vários osciladores para verificar cruzadamente os sinais e reduzir a probabilidade de interpretações falsas.
Sobrecompra e sobrevenda: como interpretar os níveis
Um dos usos mais comuns dos osciladores é identificar condições de sobrecompra e sobrevenda.
Por exemplo, em muitos osciladores:
No entanto, esses níveis não devem ser interpretados como sinais automáticos de reversão. Em tendências fortes, os ativos podem permanecer em sobrecompra ou sobrevenda por longos períodos.
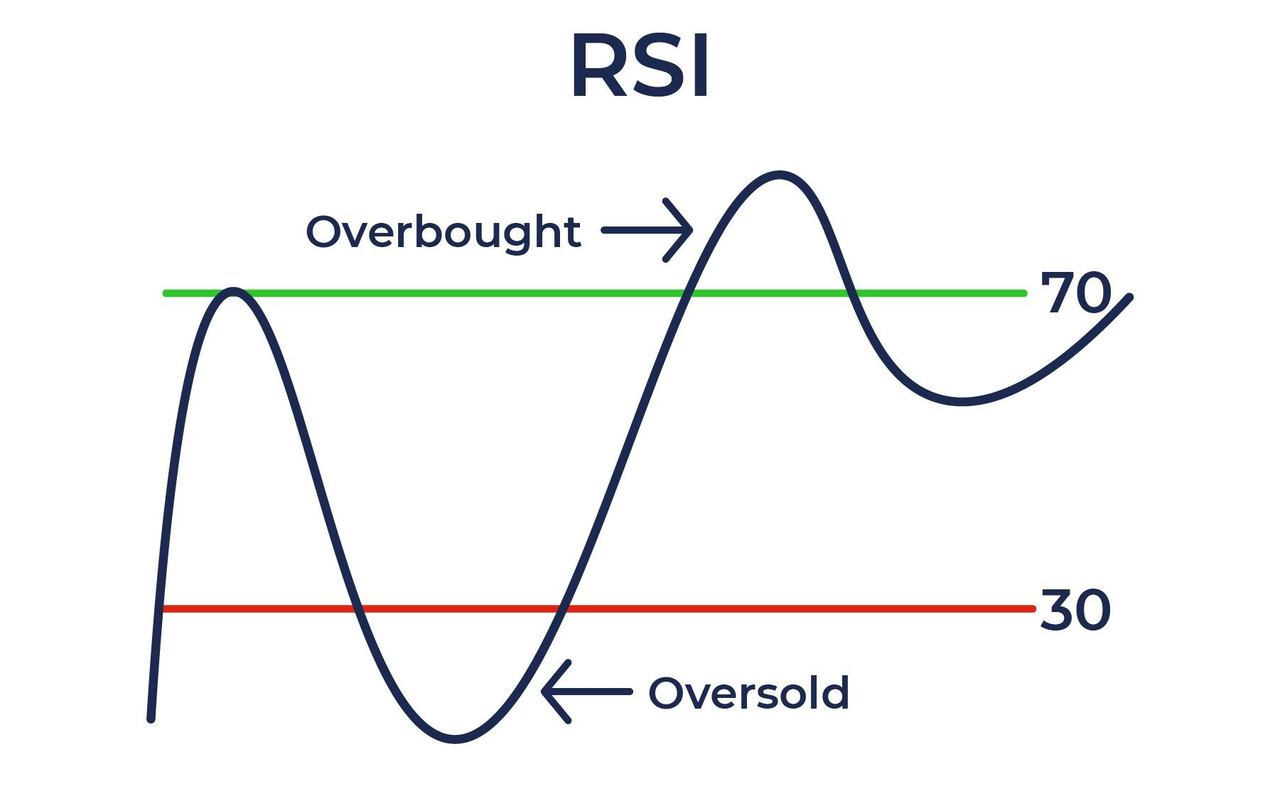
Compreender essas zonas exige contexto, incluindo a força da tendência e as condições do mercado.
Os osciladores são mais eficazes em mercados laterais ou com faixa limitada, onde os preços se movem dentro de limites previsíveis.
Em mercados com forte tendência, eles podem gerar sinais enganosos:
-
Extremos persistentes Um oscilador pode permanecer em território de sobrecompra ou sobrevenda por longos períodos.
-
Reversões falsas Sinais que sugerem uma reversão podem ocorrer mesmo quando a tendência continua.
-
Atraso na confirmação Alguns osciladores reagem depois que o momento já mudou, reduzindo a precisão do timing.
Devido a essas limitações, confiar apenas em osciladores pode levar a decisões prematuras ou incorretas.
Como os osciladores se encaixam em uma estratégia multi-indicadores
Os osciladores são mais eficazes quando usados como parte de uma estrutura analítica mais ampla.
Em uma estratégia multi-indicadores, eles são geralmente combinados com:
-
Indicadores de tendência Para confirmar a direção geral do mercado
-
Níveis de suporte e resistência Para identificar zonas de preço relevantes
-
Análise de volume Para validar a força dos movimentos de preço
Por exemplo, um trader pode usar um indicador de tendência para determinar a direção e um oscilador para cronometrar a entrada dentro dessa tendência. Essa combinação ajuda a reduzir sinais falsos e melhora a consistência das decisões.
Os osciladores atuam como uma ferramenta de refinamento, e não como um sistema autônomo, agregando profundidade à análise do mercado.
Conclusão
O momento e os osciladores oferecem uma forma estruturada de interpretar a velocidade e a força dos movimentos de preço nos mercados de criptomoedas.
Eles ajudam a identificar possíveis pontos de inflexão, destacam condições de sobrecompra ou sobrevenda e fornecem insights sobre o sentimento do mercado. No entanto, sua eficácia depende do contexto, especialmente da presença ou ausência de tendências fortes.
Compreender os osciladores como parte de um sistema analítico mais amplo permite que os traders os utilizem de forma mais eficaz, não como ferramentas preditivas, mas como indicadores de mudança de momento dentro de dinâmicas complexas de mercado.
Perguntas Frequentes
Qual é o principal objetivo dos osciladores na negociação?
Os osciladores medem o momento para ajudar a identificar possíveis reversões, condições de sobrecompra ou sobrevenda e mudanças na força do mercado.
Os osciladores são adequados para iniciantes?
Sim, muitos osciladores são amigáveis para iniciantes porque usam intervalos claros e sinais visuais, embora a interpretação adequada exija prática.
Os osciladores podem ser usados sozinhos?
Podem ser usados de forma independente, mas geralmente são mais eficazes quando combinados com outros indicadores e métodos de análise de mercado.
Qual oscilador é mais comumente usado?
O Índice de Força Relativa (RSI) é um dos mais utilizados devido à sua simplicidade e interpretação clara.
Os osciladores funcionam em todas as condições de mercado?
Funcionam melhor em mercados com faixa limitada e podem produzir sinais não confiáveis durante tendências fortes.