Bitcoin Plunges to Around $85,000 — How Much Lower Could BTC Go?

Last Updated 2026-03-27 03:09:25
Reading Time: 1m
Bitcoin has plummeted recently, at one point dropping below the $85,000 threshold and sparking widespread market panic and a wave of sell-offs. In this article, we take a deep dive into the underlying causes of this downturn, examine possible future support levels, and assess whether BTC still has room to fall.

Why Did Bitcoin Suddenly Plunge to $85,000?


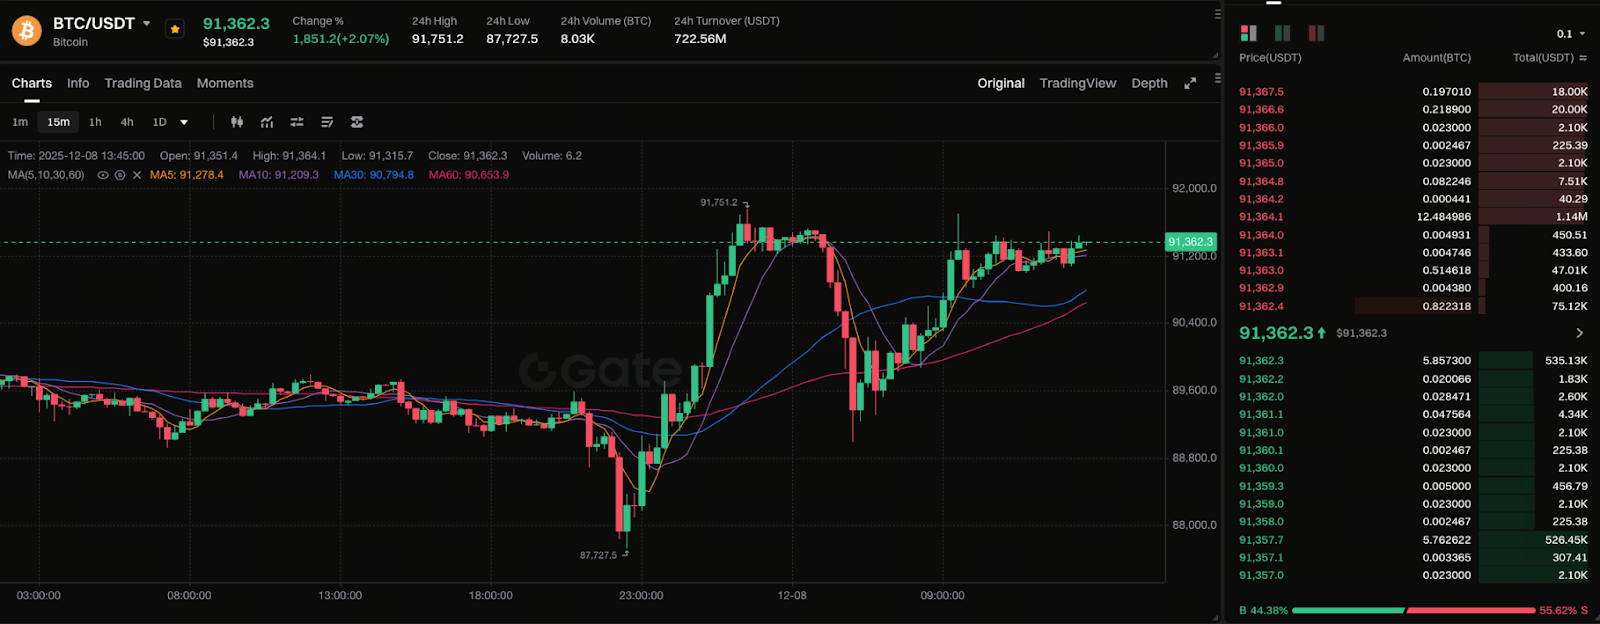
Chart: https://www.gate.com/trade/BTC_USDT

In December 2025, Bitcoin extended its previous weeks’ downtrend, briefly hitting the $85,000 level amid intense selling pressure and a wave of leveraged liquidations. This price marks a drop of more than 30% from its all-time high and broke through multiple critical support levels, sending market sentiment into panic mode almost instantly.

The abruptness of this crash caught many investors off guard. In fact, the decline wasn’t caused by a single factor but by several pressure points converging, triggering a chain-reaction pullback for BTC.

Three Core Drivers Behind Market Panic

1. Global Risk Markets Continue to Cool

Recently, global economic data uncertainty, shifting interest rate expectations, and sharp declines in tech stocks have rapidly eroded risk appetite. As a highly volatile asset, Bitcoin was among the first to face heavy selloffs.

2. Massive Leveraged Long Liquidations

In a downtrend, when prices breach key moving averages, waves of automatic liquidations are triggered. This “liquidity stampede” amplifies the selloff and further deteriorates market conditions.

3. Institutional and ETF Capital Outflows

ETFs have had a major impact on the crypto market this year. Recently, some institutions have continued to reduce their exposure, weakening buy-side demand and draining liquidity. Outflows naturally put additional downward pressure on prices.

In summary, this sharp drop was the result of combined macroeconomic pressures, negative market sentiment, and technical breakdowns.

Technical Patterns: Does BTC Have More Downside Ahead?

Chart analysis shows Bitcoin has broken through several major supports, including:

  • Mid-term uptrend line
  • 50-day and 100-day moving averages
  • High-volume price zones from the past two months

Losing these levels signals a clear short-term trend reversal to the downside.

Potential Support Zone Analysis

Based on historical volume and prior accumulation, key areas where support may emerge include:

  • Around $83,800: Recent pivot zone between bulls and bears
  • $80,000–$78,000 range: Area of significant prior buying
  • $75,000–$72,000 range: Strong mid-term support

If BTC fails to hold above $83,000–$80,000, a slide toward $75,000–$70,000 cannot be ruled out.

Bull vs. Bear Sentiment: Is Selling Pressure Nearing Its End?

Bears Still Hold the Short-Term Edge

Continued capital outflows, weak liquidity, and heightened risk aversion keep the short-term outlook bearish.

But Medium-Term Bulls Are Watching for a Reversal Signal

Some long-term investors view this correction as a “buy-the-dip” opportunity, particularly because:

  • The number of long-term holding addresses on-chain continues to increase
  • Selling pressure from long-term BTC holders has eased significantly
  • Many institutions still consider Bitcoin to be in a bull market structure

This suggests the market is not universally bearish, but rather experiencing a cyclical adjustment.

Market Outlook: Where Could BTC Fall? Where Might It Rebound?

Two Possible Scenarios:

1. Continued Bearishness → BTC Drops Toward the $75,000 Range

If:

  • ETF net outflows persist
  • Global stock markets keep falling
  • Leveraged liquidations expand again

Bitcoin could fall into even lower ranges.

2. Bulls Stabilize → Rebound to $90,000–$100,000

If:

  • Market risk appetite recovers
  • U.S. stocks stabilize
  • Strong buying emerges for BTC in the $83,000–$80,000 range

Bitcoin could return to $90K or even attempt to break $100K again.

How Should Investors Respond to This Downturn?

  • Maintain strict position sizing; avoid blindly adding leverage
  • Steer clear of emotional trading
  • Monitor for key reversal signals (such as high-volume bullish candles or candlestick reversal patterns)
  • If you have a long-term bullish outlook, consider scaling in gradually rather than making lump-sum purchases
  • Set clear stop-loss and take-profit levels; avoid trading without a plan

In times of high volatility, rational decision-making is far more important than trying to predict market moves.

Author: Max
Disclaimer
* The information is not intended to be and does not constitute financial advice or any other recommendation of any sort offered or endorsed by Gate.
* This article may not be reproduced, transmitted or copied without referencing Gate. Contravention is an infringement of Copyright Act and may be subject to legal action.

Related Articles

What is Fartcoin? All You Need to Know About FARTCOIN
Intermediate

What is Fartcoin? All You Need to Know About FARTCOIN

Fartcoin (FARTCOIN) is a representative meme coin within the Solana ecosystem based on an AI-driven narrative. Its core concept originated from an experiment aimed at exploring the "boundaries between AI Agents and humor." More than just a digital asset with social attributes, the project deeply couples absurd humor culture with on-chain financial logic by integrating autonomous AI interaction models.
2026-04-04 22:01:19
Gold Price Forecast for the Next Five Years: 2026–2030 Trend Outlook and Investment Implications, Could It Reach $6,000?
Beginner

Gold Price Forecast for the Next Five Years: 2026–2030 Trend Outlook and Investment Implications, Could It Reach $6,000?

Analyze current gold price trends alongside authoritative five-year forecasts, integrating an evaluation of market risks and opportunities. This gives investors insight into the potential trajectory of gold prices and the main drivers expected to shape the market over the next five years.
2026-03-25 18:13:30
Aster vs Hyperliquid: Which Perp DEX Will Prevail?
Beginner

Aster vs Hyperliquid: Which Perp DEX Will Prevail?

Aster and Hyperliquid are the two representative protocols of the "purpose-built L1 path" within the current decentralized perpetual exchange (Perp DEX) sector. As a pioneer in the field, Hyperliquid has built a deep liquidity moat through its highly mature order book architecture and strong community consensus. Conversely, Aster, as a rising challenger, seeks to leapfrog the competition in high-performance trading through more aggressive multi-chain aggregation logic, private transaction modules, and an underlying execution environment optimized for 2026 market demands.
2026-03-24 11:58:33
AI-Native Settlement Layers: How United Stables Is Building the Next Financial Rail
Beginner

AI-Native Settlement Layers: How United Stables Is Building the Next Financial Rail

Stablecoins were originally designed as dollar substitutes within exchanges, primarily used for asset pricing and trade settlement. As on-chain financial ecosystems have matured, their role has expanded beyond simple payments to include collateral assets, cross-chain liquidity mediums, and unified settlement units. In particular, as AI systems and automated agents begin to participate directly in economic activity, demand has risen sharply for programmable value units capable of instant settlement. This shift is pushing stablecoins toward the role of foundational financial infrastructure.
2026-03-25 03:16:17
Aerodrome Tokenomics: How ve(3,3) Powers Base's Most Profitable DEX
Beginner

Aerodrome Tokenomics: How ve(3,3) Powers Base's Most Profitable DEX

AERO is the native token of Aerodrome Finance, a core decentralized exchange and liquidity protocol in the Base ecosystem. It is primarily used for liquidity incentives and ecosystem operations. veAERO is a governance NFT that users receive by locking AERO, representing both voting power and the right to share protocol revenue. Through a dual track structure of AERO as a utility token and veAERO as a governance credential, Aerodrome separates liquidity usage value from long term governance power, allowing participants to act as liquidity providers, governance decision makers, and revenue sharers within the same system.
2026-03-25 06:40:31
The ve(3,3) Flywheel Explained: How AERO Tokenomics Powers Aerodrome’s DeFi Economy
Beginner

The ve(3,3) Flywheel Explained: How AERO Tokenomics Powers Aerodrome’s DeFi Economy

In the competition for DeFi liquidity, high-inflation mining alone is no longer enough to build lasting advantages. Aerodrome applies the ve(3,3) economic model to redesign token emissions, voting mechanisms, and revenue distribution, creating a liquidity flywheel centered on governance and cash flow. This article examines AERO tokenomics, the veAERO locking mechanism, and protocol revenue models to explain how Aerodrome builds a sustainable DeFi economic system.
2026-03-25 06:41:58