Under the spin-off framework outlined by SanDisk (SNDK), Western Digital will separate its Flash business in 2025, resulting in SNDK and WDC becoming two independent publicly listed companies. Comparing them horizontally using pre-spin-off consolidated metrics can easily conflate the HDD cycle with the NAND cycle.
What is SNDK?
SanDisk Corporation, listed on Nasdaq under the ticker SNDK, is a US equity representing NAND Flash and solid-state storage (SSD). In February 2025, SanDisk will spin off from Western Digital and complete its independent listing, with SNDK inheriting the original flash memory and SSD business from Western Digital. SNDK’s business is strictly defined within the pure Flash storage chain.
SNDK’s revenue structure is primarily driven by NAND wafer manufacturing, enterprise and client SSDs, embedded flash, and automotive solutions. The SNDK business structure and product matrix breaks down its product lines by enterprise, client, mobile, and automotive applications. SNDK’s financial performance directly reflects the average NAND selling price, SSD shipment structure, and the cadence of flash capex. These metrics should be evaluated independently from WDC’s HDD business.
Within the storage sector, SNDK and Micron are comparable at the NAND level, but SNDK’s similarity to WDC stems mainly from their shared spin-off background, not from business alignment. When reviewing financial reports or the Gate Stocks page, always use SNDK as the entry point to avoid confusing WDC’s historical consolidated data with SNDK’s disclosures.
What is WDC?
Western Digital Corporation, listed on Nasdaq with the ticker WDC, is a US equity representing mechanical hard disk drive (HDD) storage. After the SanDisk spin-off, WDC retains the HDD business and no longer directly operates NAND Flash or SSD production lines, with its business now focused exclusively on pure HDD capacity storage.
WDC’s core products target cloud data centers, enterprise archiving, and consumer external storage. Its revenue drivers include HDD shipments, cloud customer procurement, unit capacity cost, and the HDD price cycle. Following the spin-off, WDC’s direct exposure to NAND spot prices decreases. The SanDisk spin-off and WDC/SNDK relationship details the spin-off timeline and key ticker identification points.
In the HDD segment, WDC is often compared to Seagate (STX). The WDC vs Seagate vs Micron storage stock classification explains the segmentation logic among HDD, NAND, and DRAM from a broader industry perspective. When analyzing WDC, the framework should align with capacity-driven storage companies, not flash or memory manufacturers.
What is Micron?
Micron Technology, Inc., listed on Nasdaq under the ticker MU, is a US semiconductor memory company covering both DRAM (dynamic random-access memory) and NAND Flash. Its business scope is defined by manufacturing both DRAM and NAND memory types.
Micron’s products are used in servers, PCs, smartphones, and AI infrastructure, with revenues affected by both memory and flash price cycles. DRAM is focused on high-speed temporary data processing, while NAND is used for non-volatile solid-state storage. AI-related memory demand, such as HBM, also impacts its product mix. Compared to SNDK, Micron overlaps at the NAND level, but its DRAM business introduces an additional cycle dimension, making the two not directly equivalent as pure-play stocks. Micron and WDC belong to distinct segments—silicon-based memory and mechanical hard drives, respectively—so applying the same cycle logic across them is a classification error.
Key Differences at a Glance
SNDK, WDC, and Micron can be compared across four dimensions: technology path, business purity, main cycle variables, and comparable peers. The table below summarizes their structural differences to establish clear classification boundaries, without ranking any stock’s merits.
| Comparison Dimension |
SNDK (SanDisk) |
WDC (Western Digital) |
Micron (MU) |
| Ticker |
SNDK |
WDC |
MU |
| Core Technology |
NAND Flash, SSD |
HDD (mechanical hard drive) |
DRAM, NAND |
| Business Purity |
Pure Flash |
Pure HDD (post-spin-off) |
DRAM + NAND dual category |
| Main Downstream |
Cloud SSD, client SSD, embedded, automotive |
Cloud archiving, enterprise storage, consumer HDD |
Servers, PCs, mobile, AI memory |
| Core Cycle Variables |
NAND price, SSD demand, flash capex |
HDD shipments, cloud capacity demand, unit capacity cost |
DRAM price, NAND price, HBM demand |
| Spin-off Relationship |
Independent from WDC in 2025 |
Retains HDD after spin-off |
Independent entity, no spin-off relation |
| Common Comparables |
Micron (NAND level), Samsung, SK Hynix |
Seagate (STX) |
Samsung, SK Hynix, SNDK (NAND level) |
The table shows that these three companies are only broadly related as “storage” within the general data storage supply chain. While SNDK and WDC share a common spin-off origin, their technology paths are now completely separate. SNDK and Micron overlap in NAND, but Micron’s DRAM exposure adds complexity to its cycle structure. WDC and Micron have minimal comparability and must first be distinguished as HDD versus silicon-based memory.
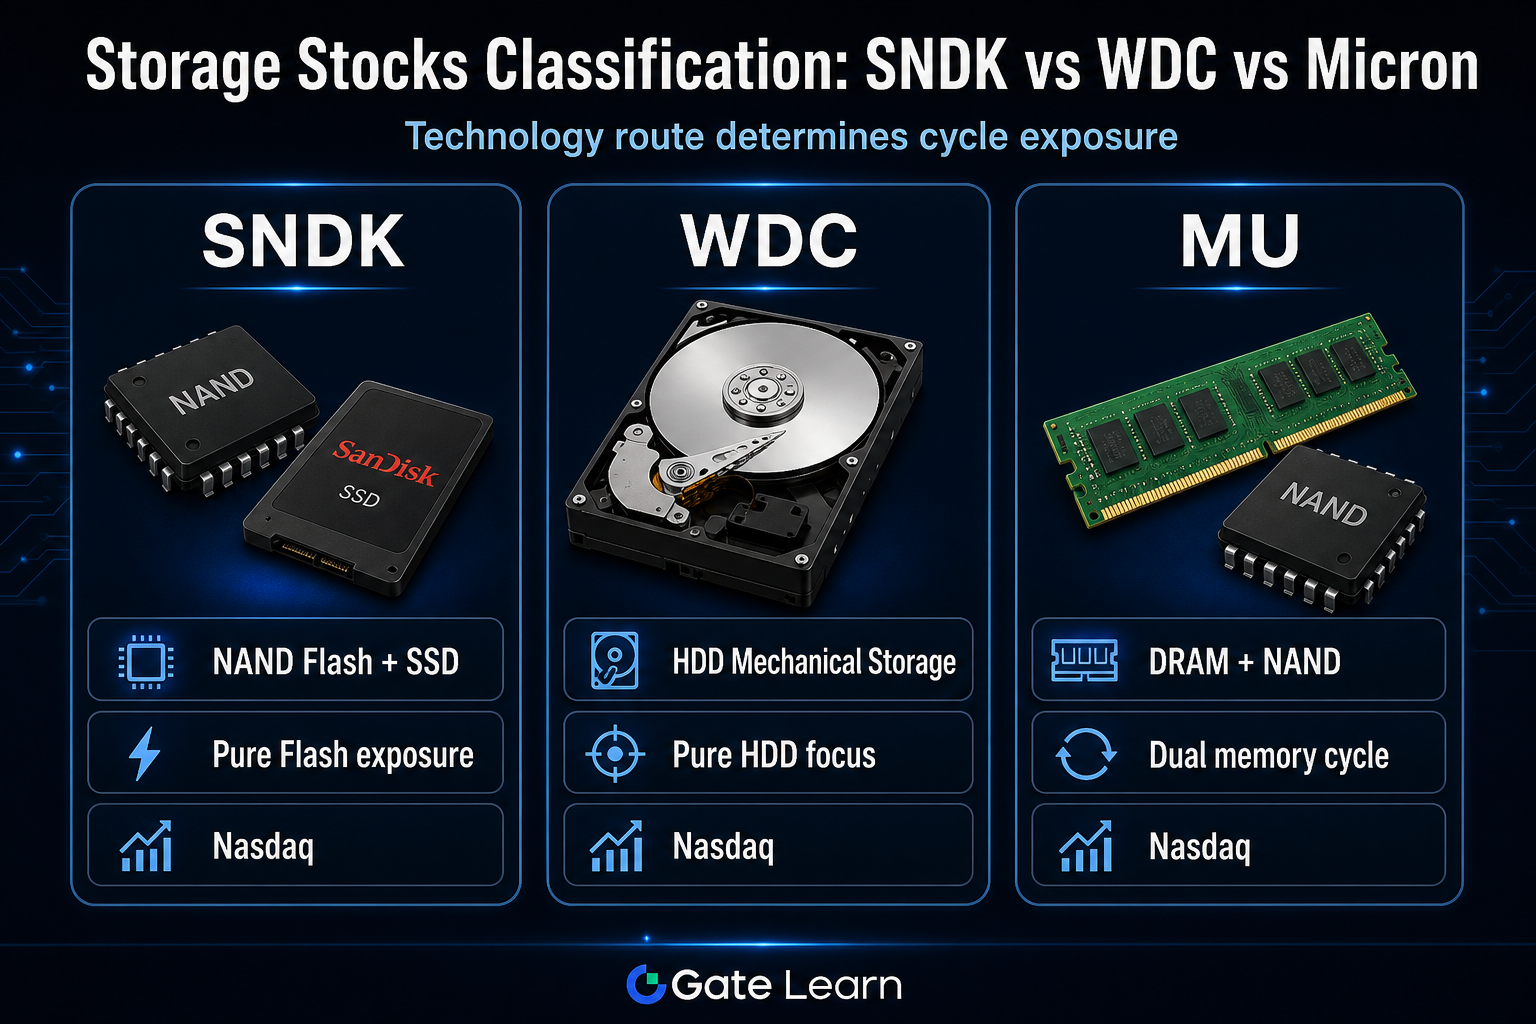 Figure 1. SNDK, WDC, and Micron US storage stocks technology path comparison: pure Flash, pure HDD, and DRAM+NAND dual category.
Which Analysis Path Should You Choose?
The first step in selecting an analysis path is to clarify which technology chain and cycle variable your research target aligns with. Each objective requires a different combination of stocks and metrics—general rankings across all three are not meaningful.
Path 1: Track NAND/SSD and flash capex
Best suited for SNDK and the NAND-related business segments of Micron. Focus on average NAND selling price, enterprise and client SSD shipments, capacity utilization, and flash capex. The SNDK core metrics and risk checklist organizes key indicators such as gross margin, inventory turnover, and capacity utilization into a systematic review framework. WDC’s HDD metrics are not directly comparable in this path.
Path 2: Track HDD capacity storage and cloud archiving demand
Best suited for WDC and Seagate (STX) in the HDD segment. Focus on HDD shipment volume, average capacity, unit capacity cost, cloud customer orders, and gross margin. In this path, SNDK’s NAND pricing and Micron’s DRAM cycle should not be included in WDC analysis.
Path 3: Track memory and flash dual cycles
Best suited for Micron. Monitor DRAM and NAND prices, inventory, downstream demand, and distinguish the impact of HBM on revenue structure. SNDK serves only as a reference for the NAND sub-segment.
| Research Objective |
Primary Stock |
Recommended Indicators |
| Flash price and SSD shipments |
SNDK |
NAND ASP, SSD structure, flash capex |
| Cloud capacity and archival storage |
WDC |
HDD shipments, average capacity, cloud customer procurement |
| Memory + flash dual cycle |
Micron |
DRAM/NAND price, HBM share, inventory |
| Post-spin-off code identification |
SNDK and WDC checked separately |
Company entity, financial reporting, ticker |
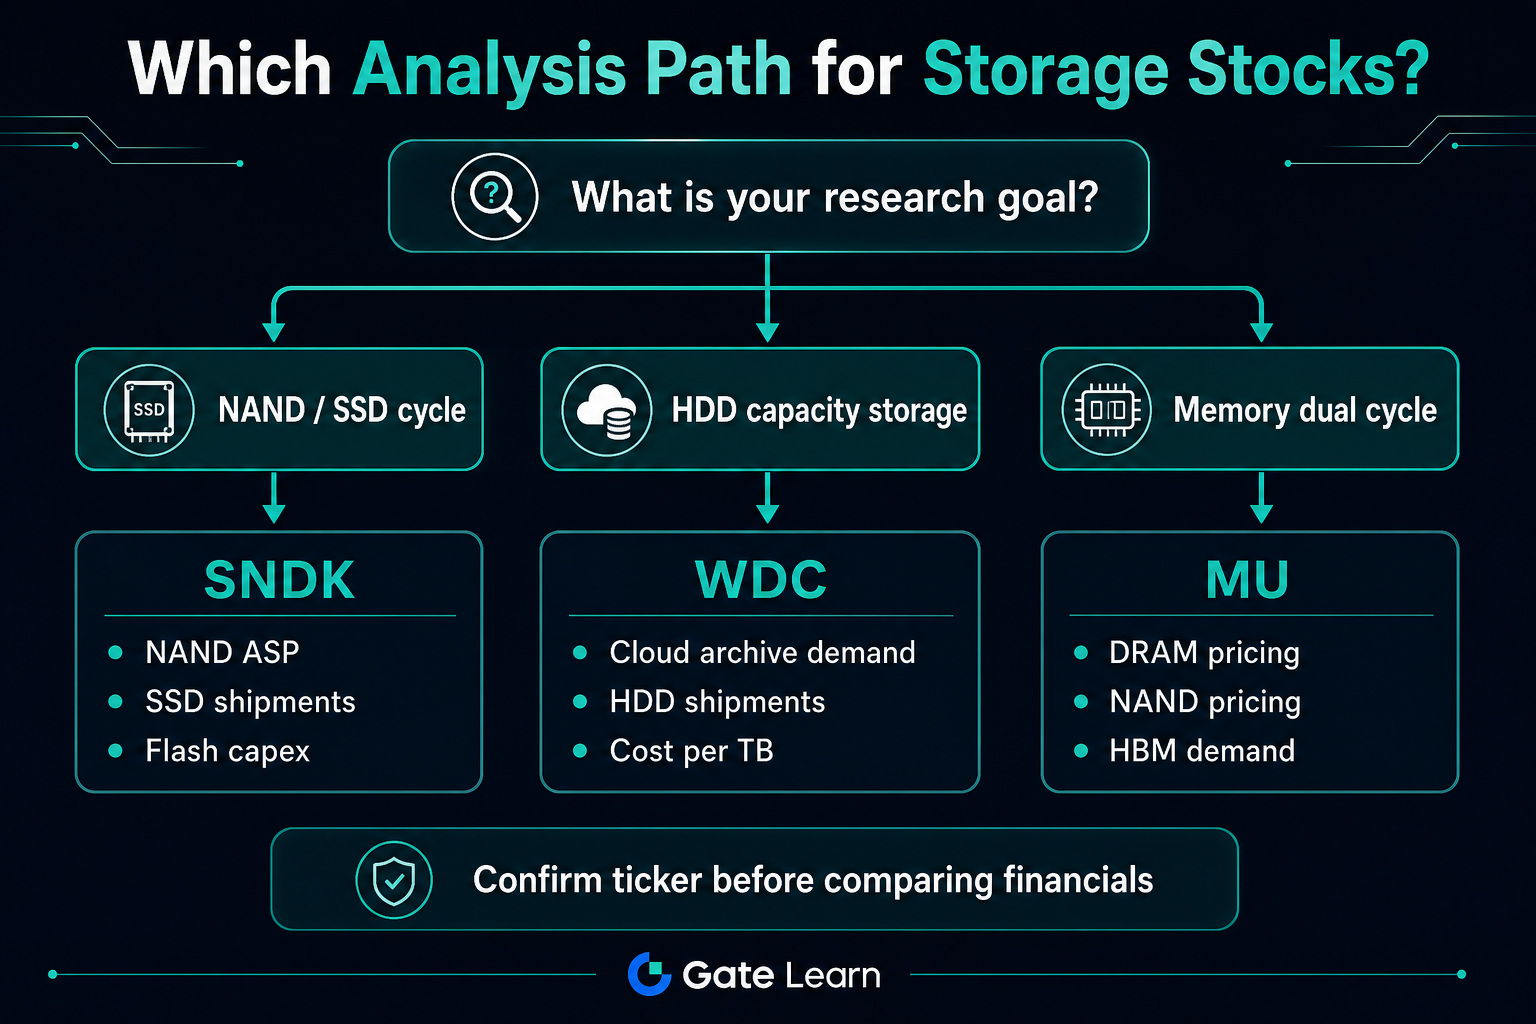 Figure 2. US storage stock analysis path selection: match SNDK, WDC, or Micron and their corresponding cycle indicators according to research objectives.
When searching on Gate Stocks, always use the tickers SNDK, WDC, and MU to confirm the main trading page, then match the company to the appropriate analysis path above. Ticker confusion is the most common mistake in storage stock comparisons.
What Are the Limitations of Comparison?
There are inherent structural limitations to horizontal comparisons among SNDK, WDC, and Micron. These must be understood before drawing any comparative conclusions.
Technical heterogeneity limits direct financial comparison
The cost structures, gross margins, and customer profiles of HDD, NAND, and DRAM differ significantly. Comparing revenue growth or profit margins without noting these technical distinctions can lead to misinterpreting industry structure differences as differences in operational capability.
Spin-off creates a break in WDC and SNDK’s historical metrics
WDC’s pre-spin-off consolidated financials included the Flash business and cannot be combined with SNDK’s independent disclosures. Post-spin-off, WDC should be evaluated based on HDD metrics, and SNDK on its own disclosures after its 2025 listing.
Micron’s dual business segments and AI-driven differences
Micron’s DRAM segment dilutes any “pure Flash” interpretation; SNDK and Micron are only partially comparable at the NAND level. AI drives DRAM, enterprise SSD, and archival storage at different rates, so the three should not be grouped under a single benefit logic.
Broad industry labels obscure individual differences
Labels like “storage stocks” or “semiconductor stocks” help with thematic filtering but cannot replace ticker-level identification. Peers such as Seagate, Samsung, and SK Hynix are not the core focus in comparisons among these three stocks.
Summary
SNDK, WDC, and Micron are all US-listed storage stocks, but they differ fundamentally in technology path and cycle exposure: SNDK is pure Flash, WDC is pure HDD, and Micron is DRAM+NAND dual category. Classification should start by confirming ticker and company, then selecting metrics according to the relevant cycle. SNDK and WDC must be analyzed as independent entities post-spin-off, and SNDK and Micron are only comparable in the NAND segment.
FAQ
Can SNDK and WDC still be compared as the same type of storage stock?
No, they cannot be directly compared as the same business. After the spin-off, WDC operates HDD while SNDK operates NAND Flash and SSD, with distinct cycle variables and financial metrics. Comparability mainly lies in their shared spin-off background, not in product or customer structure.
Which is closer to pure NAND exposure, SNDK or Micron?
SNDK’s business is focused on NAND Flash and SSD, making its exposure to the flash cycle more pure. Micron operates both DRAM and NAND, so its overall cycle is influenced by both, resulting in lower NAND purity than SNDK.
Should WDC and Micron be placed in the same comparison table?
They are only suitable for comparison at the broad “data storage industry” level, not for direct comparison of gross margin or revenue growth without noting technical differences. WDC is focused on HDD capacity storage, while Micron covers silicon-based DRAM and NAND, with different cycle drivers.
Why confirm the ticker first when researching US storage stocks?
After the SanDisk spin-off, SNDK and WDC are two independent public companies with separate tickers, financial reports, and trading pages. Micron uses the ticker MU. Mixing up tickers can lead to errors in cycle analysis and financial data references.
Will AI data center growth impact SNDK, WDC, and Micron equally?
AI will drive multi-layered storage demand, but each technology layer benefits differently. Micron is directly linked to DRAM and HBM demand, SNDK is more closely tied to enterprise SSD and NAND cycles, and WDC is more related to large-capacity archiving and HDD shipments. The three should not be grouped under a single benefit logic.
What other indicators should be checked when comparing SNDK, WDC, and Micron?
For SNDK, focus on gross margin, inventory turnover, flash capex, and capacity utilization; for WDC, check HDD shipments, average capacity, and cloud customer procurement; for Micron, track DRAM and NAND prices and inventory separately. After classification, review each metric systematically to avoid cross-chain miscomparisons.


