By plotting several moving averages with different lookback periods on one chart, the Moving Average Ribbon indicator creates a layered band that highlights trend direction, alignment, and strength. Swing traders generally associate an orderly, widening ribbon with stronger trend participation, while compression or tangled lines may signal weakening momentum, consolidation, or a possible market transition.
TL;DR
-
A Moving Average Ribbon combines several moving averages rather than relying on one line.
-
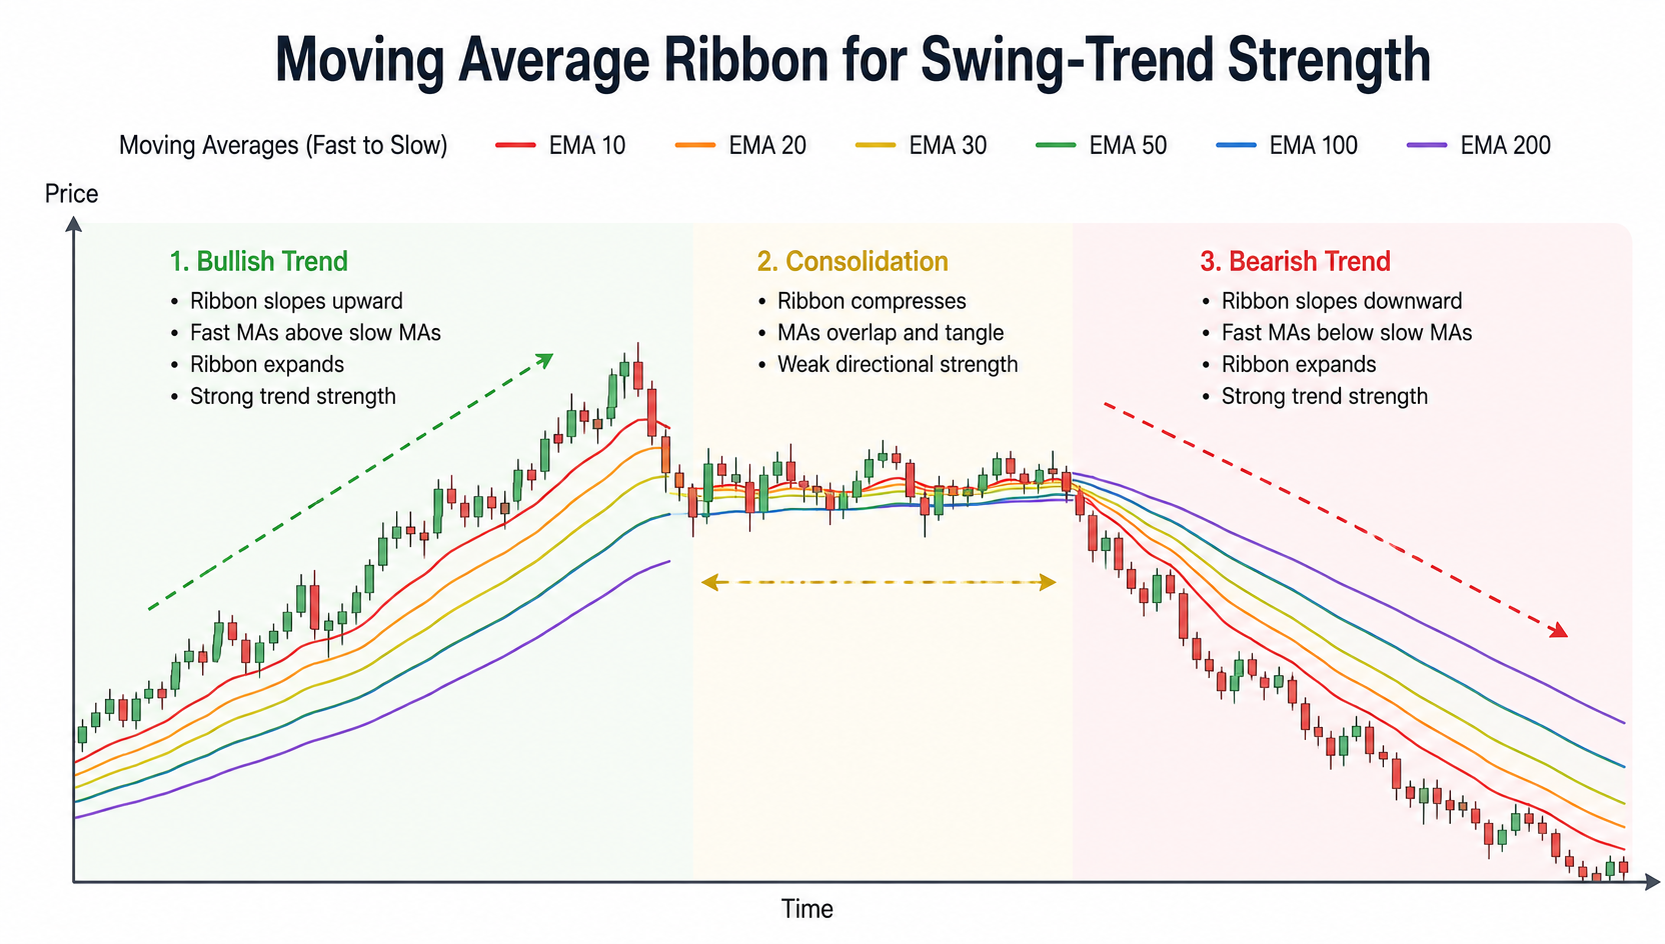
A rising, expanding ribbon generally supports a strengthening bullish trend.
-
A falling, expanding ribbon commonly indicates strengthening bearish control.
-
A compressed or intertwined ribbon suggests weaker directional alignment.
-
Moving averages use historical prices, so ribbon signals lag and can become unreliable in sideways markets.
What Is the Moving Average Ribbon Indicator?
The Moving Average Ribbon indicator is a technical analysis tool that is just a collection of multiple moving averages plotted on the same chart. A ribbon may contain six, eight, or more lines, although no universal number or period sequence applies to every chart.
Traders can build the ribbon with simple moving averages, exponential moving averages, weighted moving averages, or another consistent calculation method, using moving averages of different periods and different lengths or varying lengths. Faster averages react more quickly to recent price changes, while slower averages change more gradually.
When the moving average lines appear together, the ribbon helps identify trends by showing the direction of the trend and the current trend across short-, medium-, and longer-term horizons. Ordering shows whether the averages remain aligned, and spacing helps indicate whether momentum is strengthening or fading.
A single moving average can show whether price trades above or below its recent average. A ribbon adds more context than a single indicator by showing several average lines together at the same time. Moving Average Ribbons commonly use the distance and alignment between faster and slower averages to evaluate trend conditions.
How Does a Moving Average Ribbon Work?
A Moving Average Ribbon repeats the same moving-average calculation across several look back periods, showing how the moving average ribbon works by plotting various moving average lines on a single chart. Together, the lines form a visual band, with the ribbon moving across the chart as price and selected lookback periods change. For example, an EMA-based ribbon might use 10-, 20-, 30-, 40-, 50-, and 60-period averages, and traders can adjust the number of periods for each line.
Each period produces a separate line:
-
The shortest moving average, or short term MA, typically sits closest to the price bars and reacts first when price changes direction.
-
Medium-period averages provide an intermediate trend view.
-
Longer term lines, or a long term MA, move more slowly and reflect broader market structure.
These moving averages MAs can be read as a group because all the averages help with trend identification, or analyzed separately for trend change signals.
The calculation method affects responsiveness. The EMA 20 indicator gives greater influence to recent prices, making it more responsive to short-term momentum. The SMA indicator assigns equal weight to every price included in the selected period, generally producing a smoother but slower result.
Swing traders commonly examine four ribbon characteristics:
| Ribbon feature |
Bullish interpretation |
Bearish interpretation |
| Direction |
Most averages slope upward |
Most averages slope downward |
| Ordering |
Faster averages remain above slower averages |
Faster averages remain below slower averages |
| Separation |
Lines spread apart as price rises |
Lines spread apart as price falls |
| Price position |
Price generally remains above the ribbon |
Price generally remains below the ribbon |
The strongest trend reading appears when direction, ordering, separation, and price position agree. One characteristic alone provides weaker evidence.
How Does the Ribbon Show Trend Strength and Market Volatility?
Ribbon expansion indicates increasing separation between short- and long-period moving averages. When the structure is orderly, the ribbon can help filter out short-term market noise and clarify short term trends, even though it still lags price. During a bullish move, faster averages usually rise first and remain above slower lines. A strong trend often appears when the lines move in the same direction, stay orderly, and the ribbon is sloping upwards. Traders often watch for a new trend or entry setup when shorter term lines cross and the ribbon starts expanding in alignment, because this can highlight potential trend reversals. Continued price strength can widen the distance between them.
A bearish trend produces the opposite structure. Faster averages fall beneath slower averages, the entire ribbon slopes downward, and separation increases as selling pressure continues.
Ribbon contraction occurs when the moving averages move closer together. Compression may reflect fading momentum, consolidation, or a pullback within an established trend. It does not automatically confirm a reversal because price can pause before resuming its previous direction.
A flat or tangled ribbon indicates limited agreement between different time horizons. Repeated crossings among shorter term lines commonly appear during weak price movements, and false signals become more common in that environment. Moving averages are reactive indicators based on historical data, so they do not identify market turning points in advance.
How Can Swing Traders Use a Moving Average Ribbon?
Swing traders can use the ribbon as a technical analysis tool and trend filter rather than a precise entry signal. Its main purpose involves determining whether market structure provides enough directional alignment to support a trend-following setup, allowing traders to be more selective about trend-following opportunities, and the exact setup should match the trader’s technical analysis needs and trading style.
A bullish ribbon commonly includes:
-
Price trading above most or all ribbon lines.
-
Faster averages positioned above slower averages.
-
Most lines maintaining an upward slope.
-
Separation increasing during price advances.
-
Pullbacks occurring without completely reversing the ribbon’s order, which can support trading signals from alignment rather than precise timing alone.
During a controlled bullish pullback, price may retreat toward the faster averages while the slower section continues rising. This structure can show that short-term momentum has cooled without invalidating the broader trend. Used with other technical tools, orderly expansion can help with entries, while breakdowns in alignment can help evaluate exit points.
If the ribbon becomes flat, fully compressed, or reverses its order, the market may be undergoing a more significant transition.
Day trading may use faster settings, but this article focuses on swing-trading use. A bearish framework reverses these conditions. Price remains below the ribbon, faster averages sit beneath slower lines, and the ribbon expands downward as the trend develops.
What Settings Can Swing Traders Use?
Moving Average Ribbon settings should match the chart timeframe and the desired level of sensitivity, and the best settings vary depending on timeframe, market volatility, and trading style. Shorter lookback periods create a faster ribbon, while longer periods produce smoother but more delayed signals.
Some platforms use a default setup of 10 SMAs spaced 5 periods apart. One possible configuration uses:
-
10-period moving average
-
20-period moving average
-
30-period moving average
-
40-period moving average
-
50-period moving average
-
60-period moving average
This sequence creates evenly spaced lines across short- and medium-term price data. Other traders separate the ribbon into short-term and long-term groups. How many moving averages to include, or the number of moving averages overall, can vary depending on the strategy.
No configuration works consistently across every cryptocurrency, timeframe, or volatility environment. Adding more lines may reveal additional detail, but excessive lines can clutter the chart and make interpretation less reliable. Line colors default differently by platform, but traders often set different colors for each moving average in the ribbon for clarity.
Consistency matters more than the number of averages. A ribbon should use a clear period sequence and a consistent calculation method unless the trading approach provides a specific reason to mix them. As part of customization, the shortest moving average set can be adjusted first, since fewer periods make the ribbon react faster and more periods make it smoother.
Moving Average Ribbon vs a Single Moving Average
A single moving average provides a cleaner directional reference, while an ma ribbon combines multiple moving-average views into one visual reference and shows whether several time horizons remain aligned.
| Feature |
Moving Average Ribbon |
Single Moving Average |
| Number of lines |
Several |
One |
| Main insight |
Direction, alignment, expansion, and compression |
Average direction and price position |
| Trend-strength context |
Visible through spacing and ordering |
Mainly inferred from slope |
| Chart complexity |
Higher |
Lower |
| Main limitation |
Can become crowded |
Can hide disagreement across periods |
A single moving average may suit traders who want a straightforward trend filter. A ribbon becomes more useful when the objective involves evaluating the internal strength and consistency of a trend, because it gives more trend-identification context by letting traders read several lines on a single chart instead of relying on one average.
How Can the Moving Average Ribbon Be Confirmed?
Price structure provides the clearest confirmation of a ribbon signal. The ribbon is commonly used with other technical indicators for decision-making rather than in isolation. Higher highs and higher lows support a bullish interpretation, while lower highs and lower lows support a bearish one.
The MACD indicator can add momentum context. However, MACD and an EMA ribbon both rely on exponential moving averages, so agreement between them may represent overlapping rather than fully independent evidence.
The SuperTrend indicator adds a volatility-adjusted trend reference. A widening bullish ribbon combined with price remaining above SuperTrend may reinforce the directional reading.
The Parabolic SAR indicator serves a different purpose by providing a trailing reference for potential trend exits. The ribbon can evaluate whether the trend remains strong, while Parabolic SAR can help monitor when the existing position may need reassessment.
Using every indicator simultaneously is unnecessary. A clearer framework combines the ribbon with price structure, support and resistance, volume where reliable, and one complementary indicator. This kind of confirmation can reduce false signals and help protect potential profits when ribbon signals lag or the market consolidates.
Limitations of the Moving Average Ribbon Indicator
The Moving Average Ribbon indicator cannot measure trend strength with certainty. Greater separation between the averages shows that recent prices have moved away from longer-term averages, but it does not guarantee that the trend will continue. It can also lag enough to miss part of a move, especially at the start of a new trend.
A sharp price move may expand the ribbon shortly before exhaustion. By the time the averages begin contracting, price may have already reversed significantly.
Other limitations include:
-
Historical calculations cause delayed signals that may reduce potential profits.
-
Sideways markets can produce repeated crossings and false signals.
-
Different settings can create conflicting interpretations.
-
Closely related averages may provide redundant information.
-
Too many lines can obscure price structure.
-
Sudden volatility, liquidations, news, and thin liquidity can overwhelm indicator signals.
Longer-period bands can act like resistance zones, but those levels can fail abruptly during sharp volatility, so the ribbon should not be treated as self-sufficient.
The ribbon also does not determine position size, stop placement, or acceptable loss. Those decisions require separate risk controls.
Summary
The Moving Average Ribbon indicator helps swing traders evaluate trend strength by showing how several moving averages align, slope, expand, and contract. An orderly, widening ribbon generally supports a stronger directional interpretation, while a compressed or tangled ribbon indicates weaker agreement across different time horizons.
The indicator works best as a trend filter combined with price structure and risk management. Because every line uses historical prices, the ribbon cannot predict how long a trend will continue or guarantee that a reversal signal will be accurate.
Educational disclaimer: Technical indicators cannot guarantee trading outcomes. Digital assets are volatile, and traders should independently assess market, liquidity, leverage, and execution risks.
FAQ
Is a Moving Average Ribbon good for swing trading?
A Moving Average Ribbon can support swing trading by showing whether short-, medium-, and longer-term trends remain aligned. Its usefulness depends on the selected periods, timeframe, asset volatility, and confirmation from price structure.
Which moving averages should a ribbon use?
A ribbon can use exponential, simple, weighted, or other moving-average calculations. It combines moving averages of different lengths, with shorter settings reacting faster and longer settings smoothing long term trends. EMA ribbons react faster to recent prices, while SMA ribbons generally produce smoother but slower changes.
What does an expanding Moving Average Ribbon mean?
An expanding ribbon shows increasing separation between faster and slower moving averages. Orderly expansion in one direction often supports a strengthening trend, but it cannot guarantee continuation.
What does a compressed Moving Average Ribbon mean?
A compressed ribbon shows that the moving averages are converging. Compression may indicate fading momentum, consolidation, a temporary pullback, or an early trend transition.







