10x Research posted an analysis on X on June 25, stating that Ethereum is currently at the $1,600 support level; if this level is lost, the next target is $1,200 (the retracement level since the FTX collapse). ETH is currently trading around $1,615, below both the 7-day and 30-day moving averages (both bearish signals), with a weekly decline of 7.4%.
10x Research Analyzes Ethereum's $1,600 Support and Market Sentiment Pressure Factors
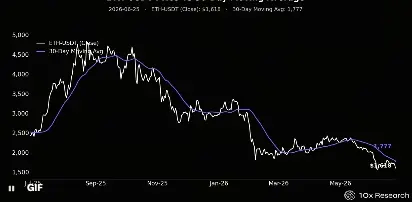 (Source: 10x Research)
According to 10x Research's X post, factors driving Ethereum's current downward pressure include:
· The Ethereum Foundation's recent 20% layoffs triggered a significant price drop;
· After key developer incentive programs expired, funding crisis warnings further dampened market sentiment;
· Persistent net outflows from spot Ethereum ETFs and weak institutional demand;
· On-chain data shows asset accumulation falling to multi-year lows;
· Rising transaction failure rates cooling network demand;
· Major macro headwinds including the Fed's hawkish stance, a strong dollar, and stock market volatility.
CryptoQuant Data Shows $1,150 Target and Historical Bottom Patterns
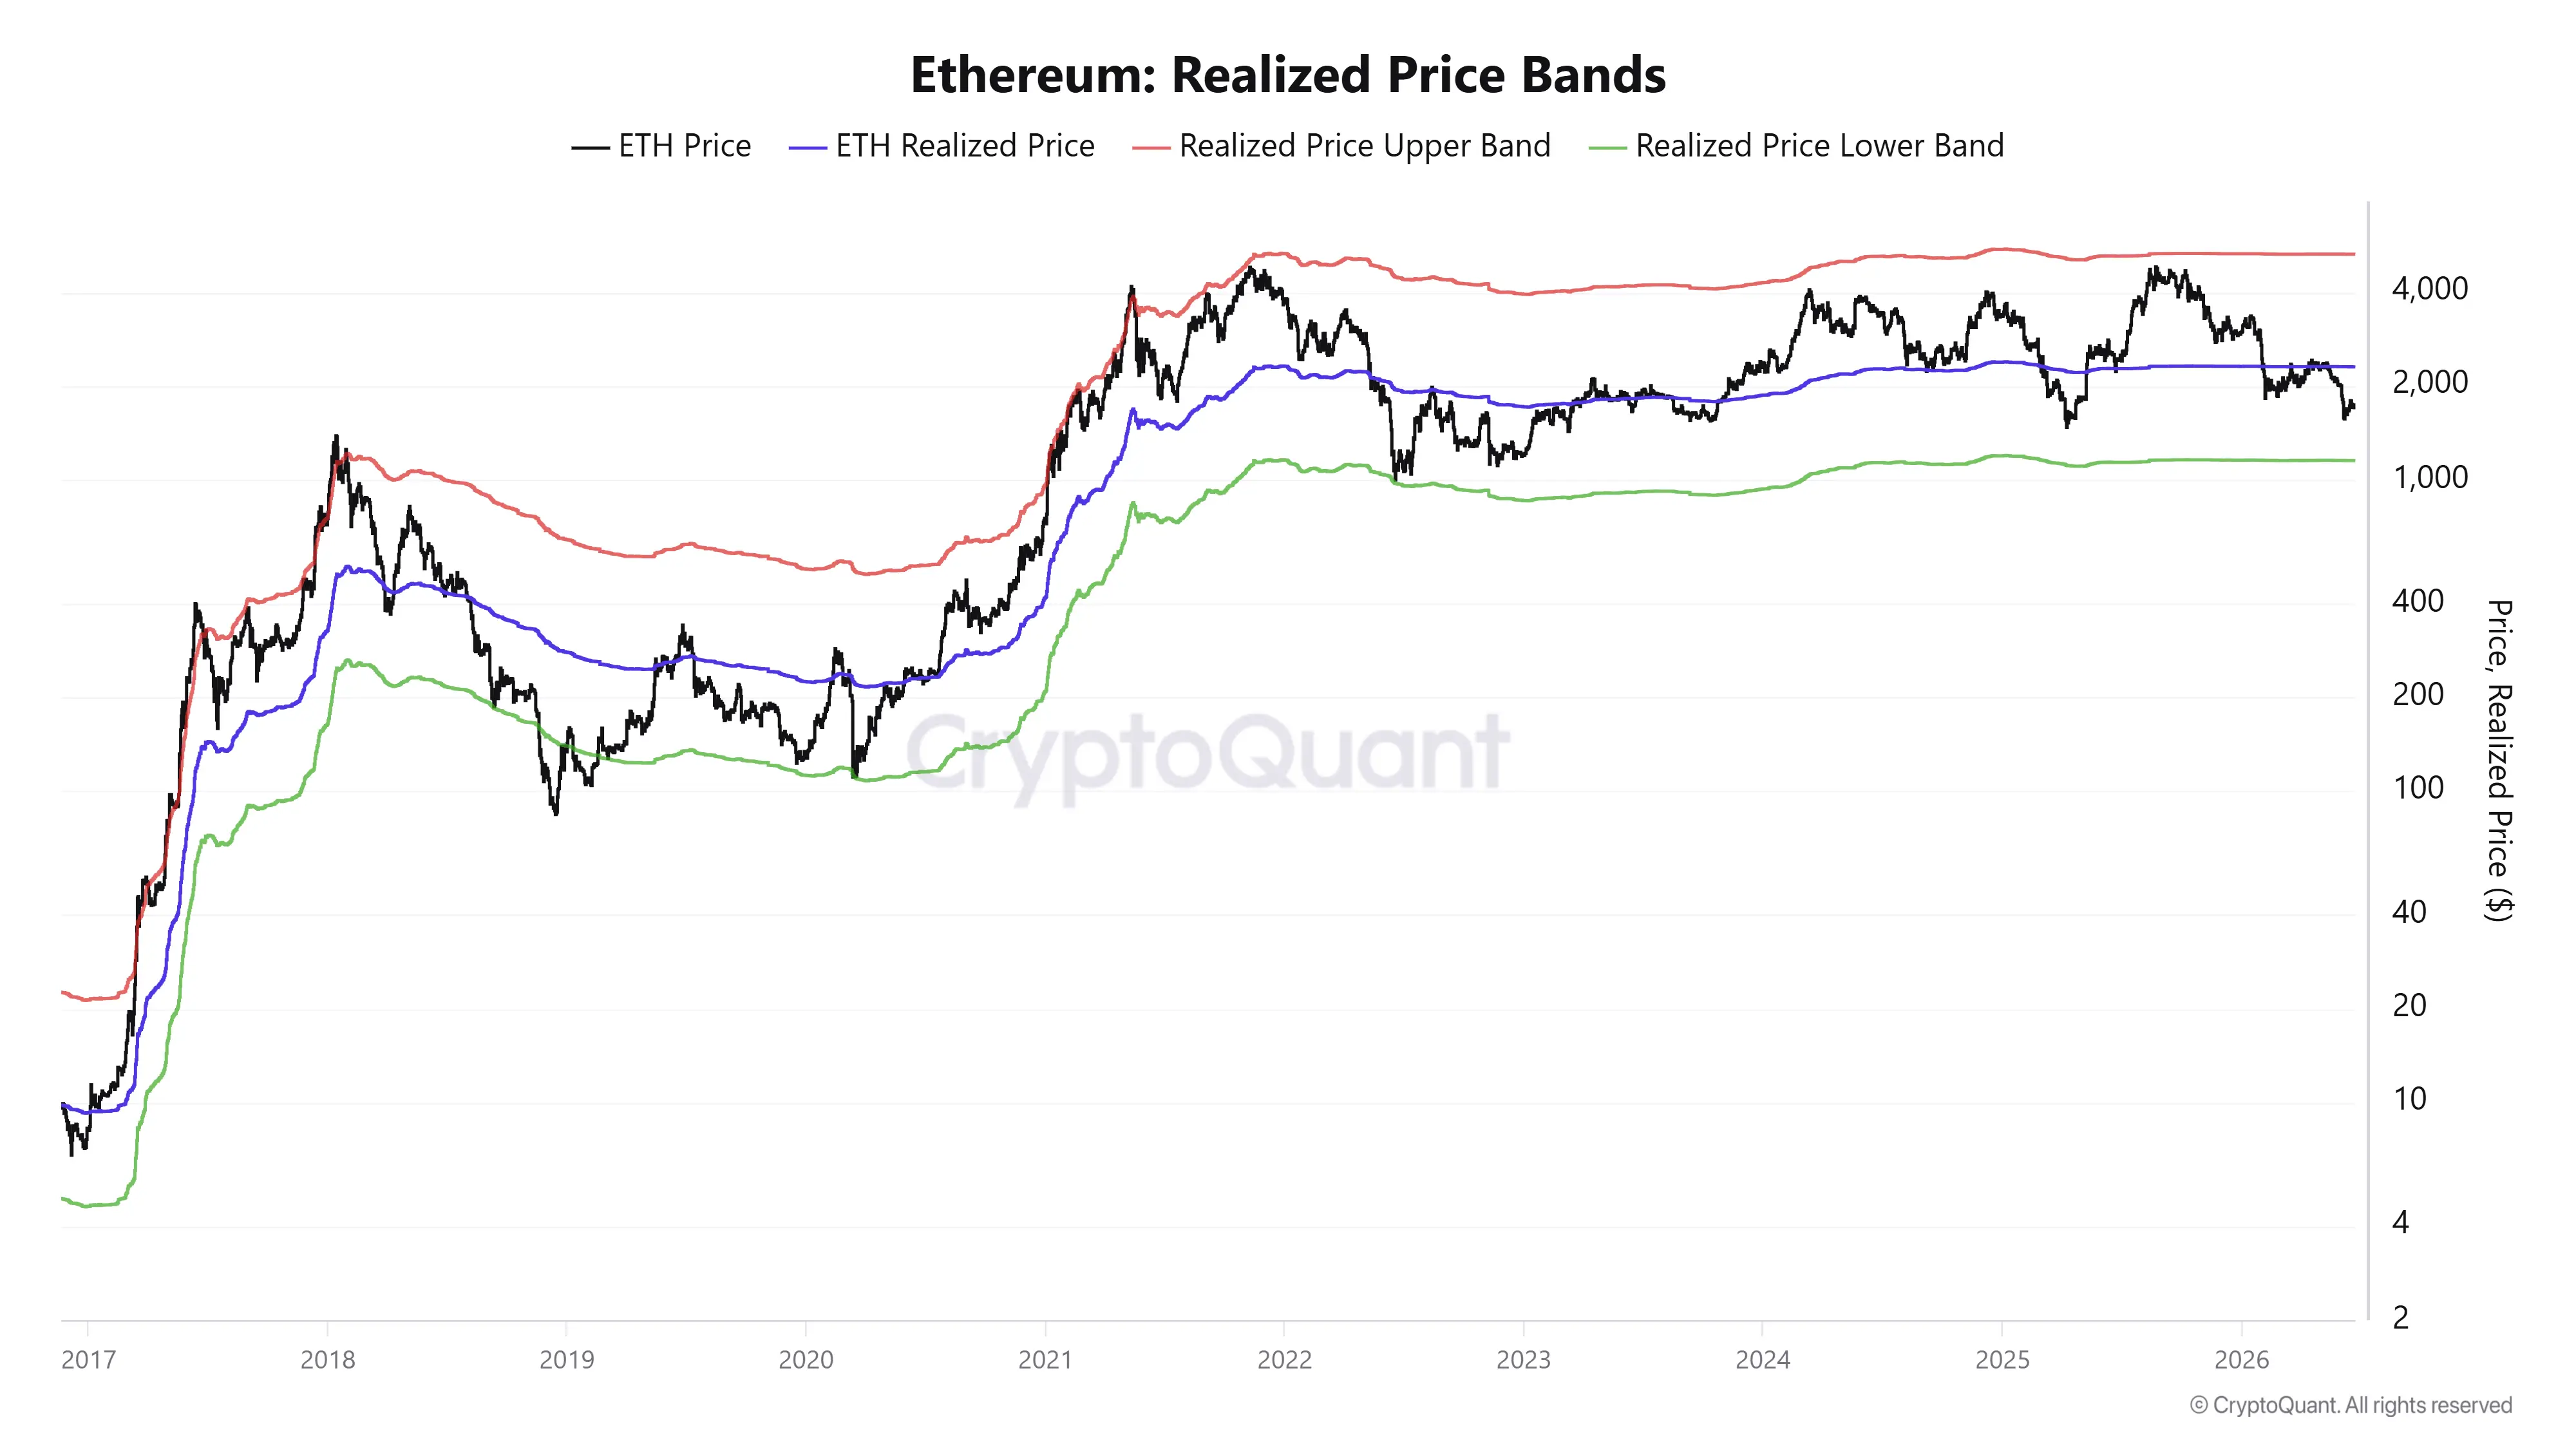 (Source: CryptoQuant)
FXStreet's analysis, citing CryptoQuant data, points out that Ethereum's Realized Price Lower Band is currently near $1,150. Historically, ETH bottomed close to this indicator during the bear markets of 2018 and 2022; last October, after approaching the upper band, ETH began a major correction, with losses exceeding 65% so far, but has not yet touched the lower band.
Based on this indicator, Ebiekutan notes that ETH may need to fall about 30% from current levels to produce a true bottom signal; historical experience shows that after bottoming, ETH needs to break through the Realized Price (the average on-chain cost for investors) resistance level to truly begin a rebound.
Spot ETH ETF Continues Outflows, $213 Million in Liquidations Over 24 Hours
According to SoSoValue and CryptoQuant data: The spot Ethereum ETF saw a net outflow of $82.3 million on Tuesday; if outflows continue for the next two days, it will mark the seventh consecutive week of outflows. Over the past two weeks, Ethereum exchange net flows have been slowly climbing, indicating a slightly bearish direction in the spot market. Liquidations over the past 24 hours reached $213 million, with longs (buyers) liquidated at $170.4 million.
On daily chart technical indicators, ETH remains below the 20-day, 50-day, and 100-day exponential moving averages (concentrated in the $1,740 to $2,050 range); the RSI is severely oversold, and the Stochastic has fallen into extremely oversold territory. Ebiekutan notes initial support around $1,611, followed by $1,524, $1,404, with deeper support near $1,156.
Frequently Asked Questions
Is 10x Research's $1,200 target a technical analysis prediction or a definitive judgment?
According to 10x Research's post, the $1,200 figure is their "next target" under the precondition that the $1,600 support level is breached—this is a conditional judgment by technical analysts, not a definitive prediction. The wording "if lost" in the article indicates it is an analysis view based on specific conditions being met.
Why is Ethereum's Realized Price Lower Band considered a potential bottom indicator?
According to FXStreet's analysis, CryptoQuant's Ethereum Realized Price Lower Band has historically marked ETH bottoms during the 2018 and 2022 bear markets; this indicator is based on on-chain investor average cost data, and when price approaches this level, it often represents extreme market pessimism. However, historical patterns may not necessarily repeat.
How to understand the market significance of the spot ETH ETF "seven consecutive weeks of outflows"?
According to SoSoValue data, if the Ethereum spot ETF continues to see outflows into the seventh consecutive week, it means institutions and professional investors are persistently reducing their exposure to ETH, directly reflecting weak institutional demand and suppressing upward momentum. 10x Research also lists "weak institutional demand for spot ETH ETFs" as one of the main market pressure factors.
