The Altcoin Season Index reached 64 as of the morning of the 4th at 10 AM, marking the highest level since October 8, according to digital asset analysis platform Coinglass. Bitcoin Dominance simultaneously fell to 57.33%, the lowest in approximately 255 days since September 22. The dual movement of these indicators reflects a shift in market funds from Bitcoin to altcoins, signaling a recovery in altcoin investment sentiment within the cryptocurrency market.
Altcoin Season Index Reaches 64 After Eight-Month Gap
The Altcoin Season Index recorded 64 as of the morning of the 4th at 10 AM, according to Coinglass. The index last reached this level on October 8 when it hit 67, approximately eight months ago.
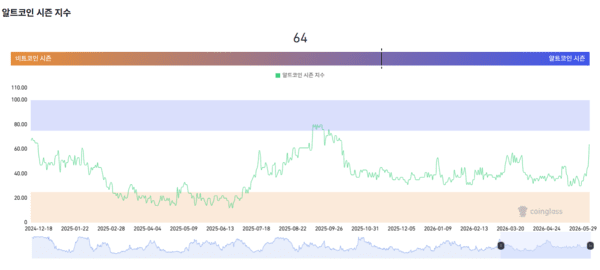 The Altcoin Season Index reached 64 as of the morning of the 4th. Source: Coinglass
The Altcoin Season Index classifies market conditions based on the performance of the top 100 cryptocurrencies by market capitalization over the past 90 days. When 75% or more of these assets outperform Bitcoin, the market enters "altcoin season." When 25% or fewer outperform Bitcoin, the market is in "bitcoin season."
The current reading of 64 falls short of the 75 threshold for altcoin season but indicates the market's center of gravity is gradually shifting from Bitcoin to altcoins. The index remained in the 30-40 range for an extended period after October 2025. In February and April 2026, the index stayed in the mid-30s as Bitcoin-dominated market conditions persisted. Recently, the index surged and recovered the 60 level.
Bitcoin Dominance Falls to 57.33%
Bitcoin Dominance recorded 57.33% as of the 4th, according to Coinglass. This represents the lowest level since September 22 when it reached 57.15%, approximately 255 days ago.
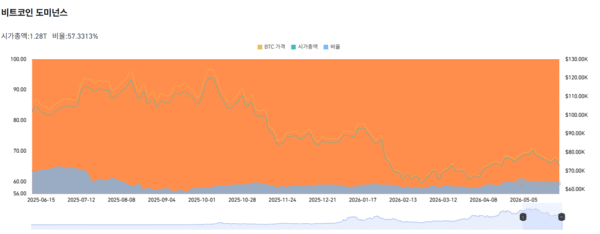 Bitcoin Dominance recorded 57.33% as of the morning of the 4th. Source: Coinglass
Bitcoin Dominance measures Bitcoin's market capitalization as a percentage of the total digital asset market capitalization. At the current level of 57.33%, Bitcoin accounts for approximately $57 out of every $100 in the total cryptocurrency market.
Bitcoin Dominance entered the 60% range in March 2025, then formed a low of 57.15% on September 22 before rebounding. The metric maintained a range of 58-60% through this year. Recent declines in Bitcoin price pushed dominance down to 57.33%.
Market Funds Shift from Bitcoin to Altcoins
Market observers note the simultaneous movement of both indicators. The rise in the Altcoin Season Index combined with the decline in Bitcoin Dominance typically signals market funds are moving from Bitcoin to altcoins.
 The Altcoin index showed an upward trend while Bitcoin Dominance declined. Source: ChatGPT
FAQ
What is the Altcoin Season Index and what does 64 indicate?
The Altcoin Season Index measures the performance of the top 100 cryptocurrencies by market capitalization relative to Bitcoin over the past 90 days. A reading of 64 indicates the market is moving toward altcoin season but has not yet crossed the 75 threshold. The index reached this level as of the morning of the 4th at 10 AM, the highest since October 8 when it recorded 67.
Why did Bitcoin Dominance fall to 57.33%?
Bitcoin Dominance fell to 57.33% as of the 4th due to recent declines in Bitcoin price combined with improving performance of altcoins. This marks the lowest level in approximately 255 days since September 22 when it reached 57.15%. The decline reflects market funds shifting from Bitcoin to alternative cryptocurrencies.
