
اعتبارًا من 9 مايو 2026، أصبحت أحداث التوقعات الشائعة على منصة Polymarket المتعلقة بسعر نهاية يونيو لعقود COMEX لذهب تسليم الشهر الأخير، واحدة من أكثر ركائز التداول الماكرو جذبًا للانتباه في أسواق التنبؤات المشفرة. وقد تجاوز إجمالي حجم التداول في هذه الواقعة 4.7 مليون دولار، إذ يبني المشاركون منحنى توزيع احتمالات كاملًا عبر عتبات سعرية مختلفة.
المصدر: Polymarket
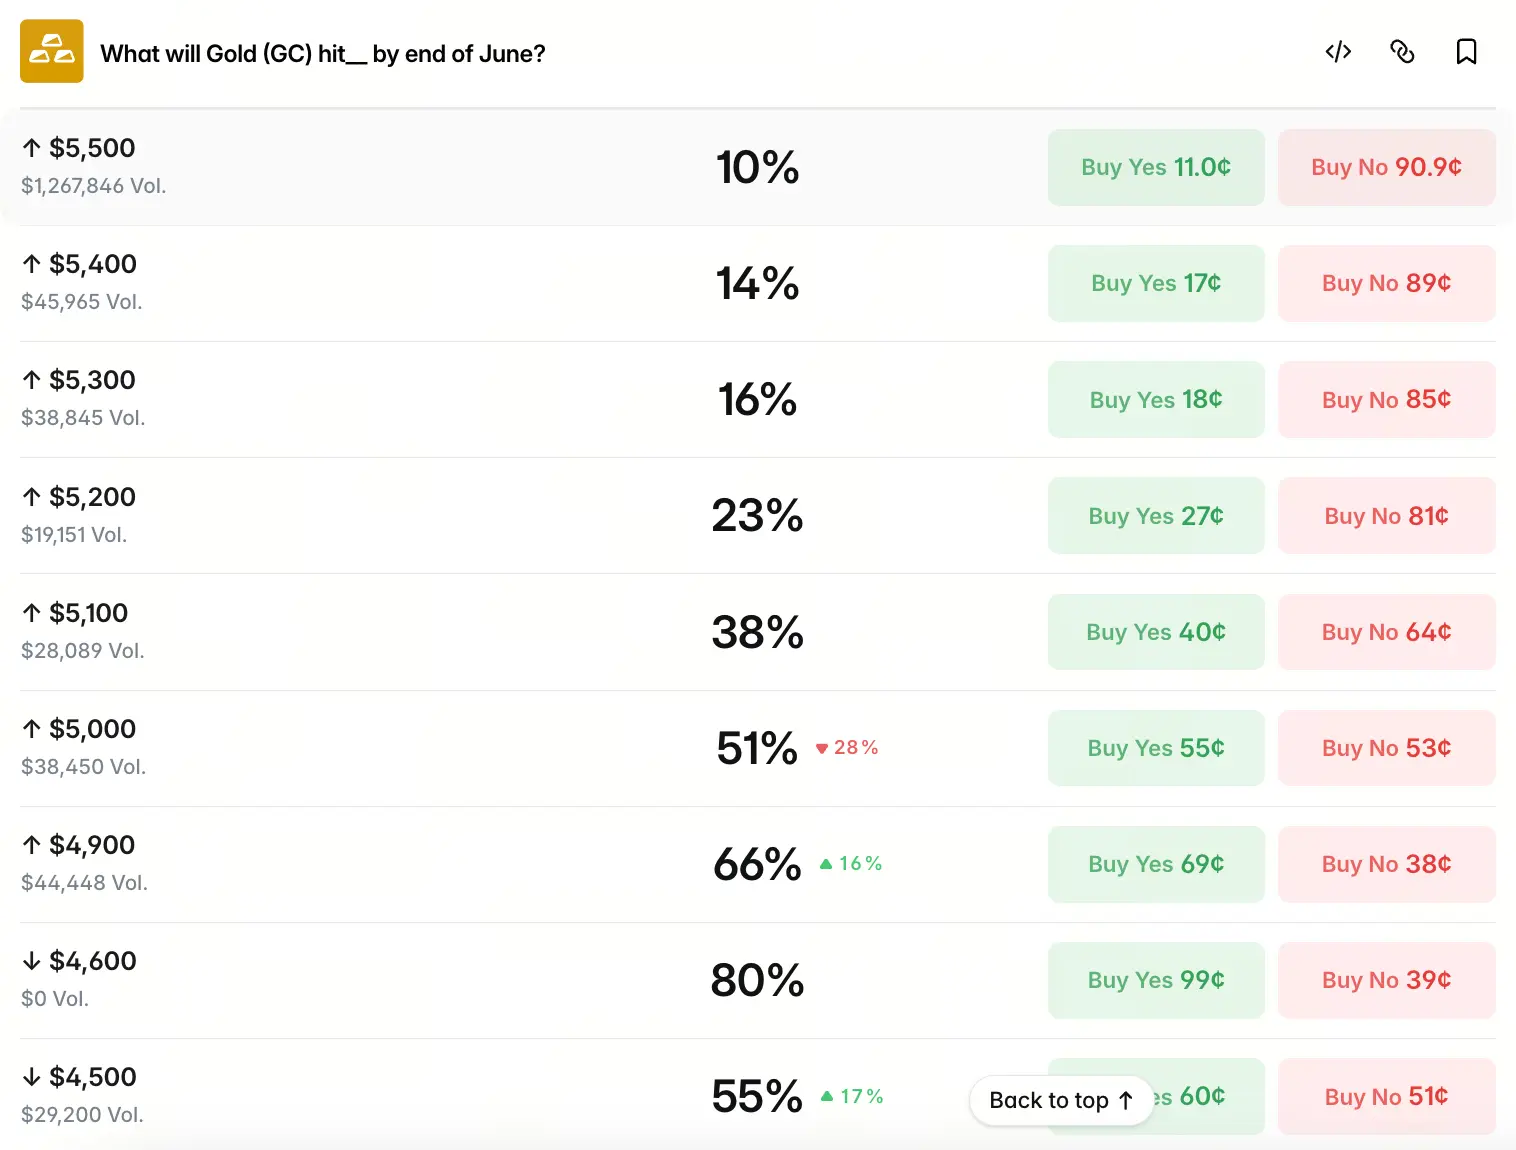
استنادًا إلى سعر التسوية الرسمي لعقود CME للذهب باعتباره معيارًا للحكم، خصص السوق احتمالات لكل شريحة سعرية كما يلي: احتمال أن يصل سعر الذهب إلى 5,500 دولار هو 10%، و5,400 دولار هو 14%، و5,300 دولار هو 16%، و5,200 دولار هو 23%، و5,100 دولار هو 38%، و5,000 دولار هو 51%، و4,900 دولار هو 68%. وحول 4,600 دولار ارتفعت الاحتمالات مؤقتًا إلى مستوى مرتفع بلغ 80%. أما عند 4,500 دولار و4,400 دولار و4,300 دولار فقد تراجعت الاحتمالات إلى 55% و41% و25% على التوالي، بينما بقي عند 4,200 دولار فقط 17%.
تعكس هذه التوزيعة انحيازًا واضحًا بالشكل “تَركّز الاحتمالات في نطاق عالٍ بين 4,900 و5,000 دولار” مع ميل يميني. يمثل 5,000 دولار نقطة التحول المحورية في منحنى الاحتمالات—ففوق هذا السعر، ينخفض الاحتمال بمقدار 10 إلى 15 نقطة مئوية كلما ارتفع السعر 100 دولار. أما تحت 4,900 دولار، فتزداد سرعة تآكل الاحتمال بشكل ملحوظ؛ إذ إن احتمالات كل شريحة سعرية أدنى من 4,600 دولار أقل بكثير من تلك ضمن نطاق الأسعار الأعلى. وهذا يشير إلى أن “مركز ضبط” التسعير الجماعي في سوق التنبؤات يتم ترسيخه عند نطاق 4,900–5,000 دولار، مع بقاء علاوة مخاطرة صعودية تبلغ نحو 50 نقطة مئوية لما فوق 5,000 دولار.
ما هي شروط الحدود الأساسية للتسعير في السوق؟
إن توزيع الاحتمالات الذي تقدمه أسواق التنبؤات ليس مبعثرًا عشوائيًا، بل يتبع منطق تسعير داخليًا. ولإدراك كيفية تشكل هذا التوزيع، يلزم الرجوع إلى القوى المحركة الجوهرية لتسعير الذهب حاليًا. في أبريل 2026، رسمت عقود COMEX للذهب دورة نمطية من “صعود حاد—تراجع—استقرار”. بدأت بداية الشهر عند 4,698.4 دولار/الأونصة، وخلال النصف الأول استمر الارتفاع مدفوعًا بالمخاطر الجيوسياسية في الشرق الأوسط، إضافةً إلى دعم مشتريات البنوك المركزية العالمية لسبائك الذهب. وفي 17 أبريل، لامس الذهب ذروة شهرية عند 4,918 دولار. لكن في النصف الثاني انعكس المشهد سريعًا؛ إذ ارتد مؤشر الدولار وعادت عوائد السندات الأميركية الحقيقية إلى الارتفاع، وتراجعت مشاعر الملاذ الآمن في الشرق الأوسط، فهبط الذهب بقوة. ففي 21 أبريل سجل هبوطًا يوميًا بأكثر من 2% وهبطت الأسعار تحت حاجز 4,700 دولار، ثم دخلت الأسعار بعدها في نطاق تذبذب واستقرار قرب 4,700 دولار. وحتى 9 مايو، بلغ سعر الذهب المؤقت 4,720 دولارًا، مع تذبذب محدود خلال آخر 24 ساعة.
تكمن القيود الأساسية على تسعير السوق في هذا السياق: تمرير الأحداث الجيوسياسية عبر أسعار الطاقة إلى توقعات التضخم، ثم عبر مسار أسعار الفائدة لدى الاحتياطي الفيدرالي إلى العوائد الحقيقية، قبل أن تنعكس في النهاية على تسعير الذهب. إن سلسلة “الصراع بين إيران وإسرائيل (أو النزاع الإيراني-الإسرائيلي) → ارتفاع أسعار النفط → ارتفاع توقعات التضخم → تراجع توقعات خفض الفائدة → ارتفاع العوائد الحقيقية → ضغط على الذهب باعتباره أصلًا بلا عائد” تجعل سمة تجنب المخاطر للأحداث الجيوسياسية وقدرة الانكماش الماكرو على الموازنة، بل قد تقود إلى حالة يتم فيها كبح مشتريات الملاذ الآمن بالكامل تقريبًا. إن صراع القوى بين المضاربين على الصعود والهبوط في السوق الحالي هو نتاج هذا الميكانيزم المعقد للتناقل.
كيف يؤثر اختلاف مؤسسات وول ستريت على توقعات السوق؟
إضافةً إلى توزيع احتمالات سوق التنبؤات، تشكل أحدث تقييمات بنوك الاستثمار في وول ستريت مرجعًا محوريًا ثانيًا. وبعد هبوط سريع بنحو 25% في مارس، وما تلاه من شد وجذب داخل نطاق خلال أبريل بأكمله، شهدت توقعات المؤسسات لسعر الذهب في نهاية العام تباينًا واضحًا—وهذا التباين بحد ذاته انعكاس مباشر لعدم يقين السوق.
حافظ بنك جولدمان ساكس على سعره المستهدف لنهاية 2026 عند 5,400 دولار دون تغيير، معتبرًا أن مشتريات البنوك المركزية تظل أقوى دعامة هيكلية، ومتوقعًا أن تقوم البنوك المركزية عالميًا خلال 2026 بمتوسط صافي شراء يبلغ 60 طنًا من الذهب شهريًا. في المقابل، خفضت مورغان ستانلي في أواخر أبريل بشكل حاد توقعاتها السابقة، فخفضت سعرها المستهدف للنصف الثاني من 2026 من 5,700 دولار إلى 5,200 دولار، أي بانخفاض يقارب 10%، مشيرة إلى أن “صدمة الإمداد” وارتفاع العوائد الحقيقية الناجم عن تأخر خفض الفائدة من الاحتياطي الفيدرالي قد غيّرا معًا أساس تسعير الذهب. أما جيه. بي مورغان، فحافظت على موقف أكثر جرأة، متوقعة أن يصل سعر الذهب إلى 6,300 دولار بنهاية العام.
إن هذا التباين الكبير في تقييم المؤسسات للمتغير الماكروي نفسه يوضح بالضبط أن منطق تسعير سوق الذهب يخضع حاليًا لإعادة بناء عميقة. وتقوم احتمالية القمة قرب 5,000 دولار التي يقدمها سوق التنبؤات بتجميع—إلى حد ما—قوة هذه الخلافات، بدل أن تميل بشكل مبسط إلى توقع طرف بعينه.
كيف تشكّل مسارات الفائدة والمخاطر الجيوسياسية منطق الدوافع المركبة للذهب؟
على المستوى الماكروي، يواجه سوق الذهب منذ أبريل 2026 حتى الآن محفزات متعددة تتجه في اتجاهات مختلفة، وتؤثر كل قوة منها على السعر عبر تأثيرات مركبة ومعقدة.
قد يكون اتجاه السياسة النقدية هو المتغير الأكثر جوهرية. فقد قرر اجتماع لجنة السياسة النقدية لدى الاحتياطي الفيدرالي في أواخر أبريل الإبقاء على نطاق هدف سعر الأموال الفيدرالية عند 3.5%–3.75% بقرار تصويت 8 إلى 4، وهو ما يمثل أكبر تباين في الرأي منذ عام 1992. كما تقلصت توقعات خفض الفائدة خلال العام إلى أدنى مستوياتها—وتُظهر بيانات CME FedWatch أن احتمال الإبقاء على السياسة دون تغيير في ديسمبر 2026 ارتفع من 80% إلى 85%. ويعني ارتفاع العوائد الحقيقية أن تكلفة الفرصة لحيازة الذهب دون عائد تزيد، ما يفرض ضغطًا مستمرًا على سعر الذهب.
ومع ذلك، لا يمكن تجاهل قوة الموازنة التي تأتي من الجانب الجيوسياسي أيضًا. إذ يستمر التعثر في الصراع بين إيران وإسرائيل، وتسارع البنوك المركزية العالمية في تنفيذ إزالة الاعتماد على السندات الأميركية وتنويع تخصيصات الاحتياطيات. يوفّر هذا الاتجاه البنيوي دعمًا راسخًا لرفع مركز الثقل على المدى المتوسط والطويل لسعر الذهب. وتشير شركة سيتيك أنترناشونال (سيتيك-سيتيك؟) للتداول بالسلع الآجلة إلى أن عدم اليقين في الشرق الأوسط ما زال يضغط على المعادن الثمينة على المدى القصير، لكن مخاطر التضخم الراكدة في الولايات المتحدة على المدى الطويل وعملية التخلص من الدولرة تدعم الذهب بصورة مستقرة.
وتفسيرًا لاجتماع الضغط قصير الأجل مع الدعم طويل الأجل، يبرز سبب أن سوق التنبؤات، رغم منح 4,900 دولار احتمالًا يبلغ 68%، يحتفظ أيضًا بمساحة صعودية محدودة لكنها ذات دلالة إحصائية في الأسعار الأعلى.
كيف ينبغي تفكيك سيناريوهات المخاطر عبر نطاقات أسعار مختلفة؟
استنادًا إلى منطق الدوافع المركبة أعلاه، تقابل عدة نقاط محورية في منحنى احتمالات Polymarket—فعليًا—توقعات لسيناريوهات ماكرو مختلفة.
اعتبر نطاق 4,900–5,000 دولار بوصفه “سيناريو الأساس” لسوق التنبؤات الحالية—إذ تتراوح الاحتمالات بين 51% و68%، ما يعكس اعتقاد السوق بأن هذا هو نتيجة السعر الأكثر قابلية للحدوث. وترتبط هذه الفئة ارتباطًا وثيقًا بذروة أبريل عند 4,918 دولار، كما تتماشى مع أسعار مستهدفة مُعدلة لدى بعض المؤسسات.
يتخذ نطاق 5,000–5,400 دولار مسار تراجع تدريجي في الاحتمالات، لينخفض من 51% إلى 14%. ويعكس معدل التراجع هذا—إلى حد ما—قلق السوق من أن استمرار الحصار على مضيق هرمز يرفع أسعار النفط، ما يؤدي إلى تأجيل إضافي لتوقعات خفض الفائدة؛ وفي سيناريوهات المخاطر الخلفية هذه، سيتم كبح الارتفاع قصير الأجل للذهب بشكل واضح. كما تتوافق هذه الفئة بصمت مع الهدف السنوي لبنك جولدمان ساكس عند 5,400 دولار ومع حكمه بأن “المخاطر قصيرة الأجل تميل إلى الهبوط”.
أما توزيع الاحتمالات تحت 4,800 دولار، فيُظهر سمة “هبوط حاد” بشكل قوي: إذ بلغ احتمال 4,600 دولار مستوى مرتفعًا مرةً عند 80%، لكن انخفض إلى 55% عند 4,500 دولار، و41% عند 4,400 دولار، و25% عند 4,300 دولار. ويعني تآكل الاحتمال بسرعة تحت 4,600 دولار أن السوق يرى أن احتمال تراجع سعر الذهب كثيرًا بعد كسره 4,600 دولار محدود نسبيًا، وأن هناك دعمًا للتسعير في الأسفل.
ما القيمة الإضافية التي يمكن أن يقدمها بيانات سوق التنبؤات لاتخاذ قرار استثماري؟
من منظور كفاءة المعلومات، توجد علاقة تكاملية مهمة بين بيانات احتمالات سوق التنبؤات والمؤشرات الاقتصادية الكلاسيكية. تعتمد النماذج التقليدية بدرجة عالية على متغيرات ماكرو مثل مسار الفائدة ومؤشر الدولار والتضخم، بينما تقوم منصات مثل Polymarket—عبر رهانات “بالمال الحقيقي”—بتجميع المعلومات المتفرقة لدى آلاف المشاركين وتحويلها إلى مجموعة قابلة للقياس من توزيعات الاحتمالات.
تُعد هذه آلية التسعير الجماعي مناسبة بشكل خاص للبيئة الحالية التي تتداخل فيها عوامل الصعود والهبوط على نحو كبير. إذ إن نبضات الصراع الجيوسياسي قصيرة الأجل، وتغيرات مزاج المستثمرين، وعلاوات المخاطر المرتبطة بأحداث مفاجئة محتملة، التي لا يمكن للنماذج التقليدية تركيبها بسهولة، يمكن أن تظهر داخل هيكل فروقات السعر في سوق التنبؤات. وتتمثل إحدى ميزات التحليل الأخرى في بيانات Polymarket في أن الأجل محدد بوضوح—إذ، مقارنةً بالتنبؤ بنهاية العام وحتى 2027، فإن أجل نهاية يونيو يتطابق بشكل طبيعي مع نافذة الملاحظة لاتجاه السياسة النقدية وتطورات المشهد الجيوسياسي على مراحل، ما يعزز ذلك من موثوقيتها بوصفها مرجعًا للتسعير قصير الأجل.
FAQ
Q1: ما أساس سعر الذهب في تنبؤات Polymarket؟
تستخدم أسواق التنبؤات سعر التسوية الرسمي لعقود CME للذهب كمعيار للحكم، ولا يتم أخذ أسعار التداول داخل اليوم ولا الأسعار المرتفعة ولا الأسعار المنخفضة ولا مختلف العروض السعرية الوسيطة في الاعتبار. وهذا يعني أن الحكم النهائي يستند إلى معيار كمي موحد وغير قابل للجدل.
Q2: هل يمكن أن تُعد احتمالات سوق التنبؤات مرجعًا سعريًا؟
تُعد احتمالات سوق التنبؤات، جوهريًا، تسعيرًا جمعيًا يتشكل بعد الرهان بالمال من قِبل المشاركين، وليست تنبؤًا رقميًا لسعر المستقبل. يمكن اعتبارها تسعيرًا “خياريًا” فوريًا لاحتمالية وقوع نطاق سعر معين، لكنها لا يمكن مساواتها بأداة تحليل حتمية، ولا تشكل أي نوع من نصائح الاستثمار.
Q3: كيف يؤثر تعارض جيوسياسي مع السياسة النقدية للاحتياطي الفيدرالي معًا على مسار الذهب؟
تتمثل الفكرة المحورية لتسعير الذهب الحالي في وجود طبقتين من الموازنة المتبادلة: إذ تؤدي التوترات بين إيران وإسرائيل إلى رفع أسعار النفط بما يسرّع ارتفاع توقعات التضخم، وبالتالي إلى تأخير خفض الفائدة من الاحتياطي الفيدرالي ورفع العوائد الحقيقية، ما يزيد تكلفة الفرصة لحيازة الذهب دون عائد؛ وفي الوقت نفسه، تدفع الأزمة الجيوسياسية نفسها البنوك المركزية عالميًا إلى تسريع إزالة الاعتماد على الدولار في التخصيصات، ما يوفر دعمًا بنيويًا طويل الأجل للذهب. إن وجود ضغط قصير الأجل مع دعم طويل الأجل هو التناقض الجوهري في تسعير السوق الحالي.
Q4: ما العلاقة بين تنبؤات المؤسسات وسوق التنبؤات؟
يشكل الطرفان عنصرين مكملين من حيث مستوى التحليل. إذ تقدم تنبؤات المؤسسات نتائج استدلالية مبنية على افتراضات محددة، بينما يجمع سوق التنبؤات الأحكام المتفرقة لمشاركين متعددين عبر تدفقات الأموال. توجد بينهما درجة من الاتساق—على سبيل المثال الميل تجاه سعر 5,000 دولار—لكن توجد أيضًا نقاط خلاف؛ ويعكس هذا الخلاف، بحد ذاته، بصورة مباشرة تعقيد السوق الحالي وعدم يقينه.

