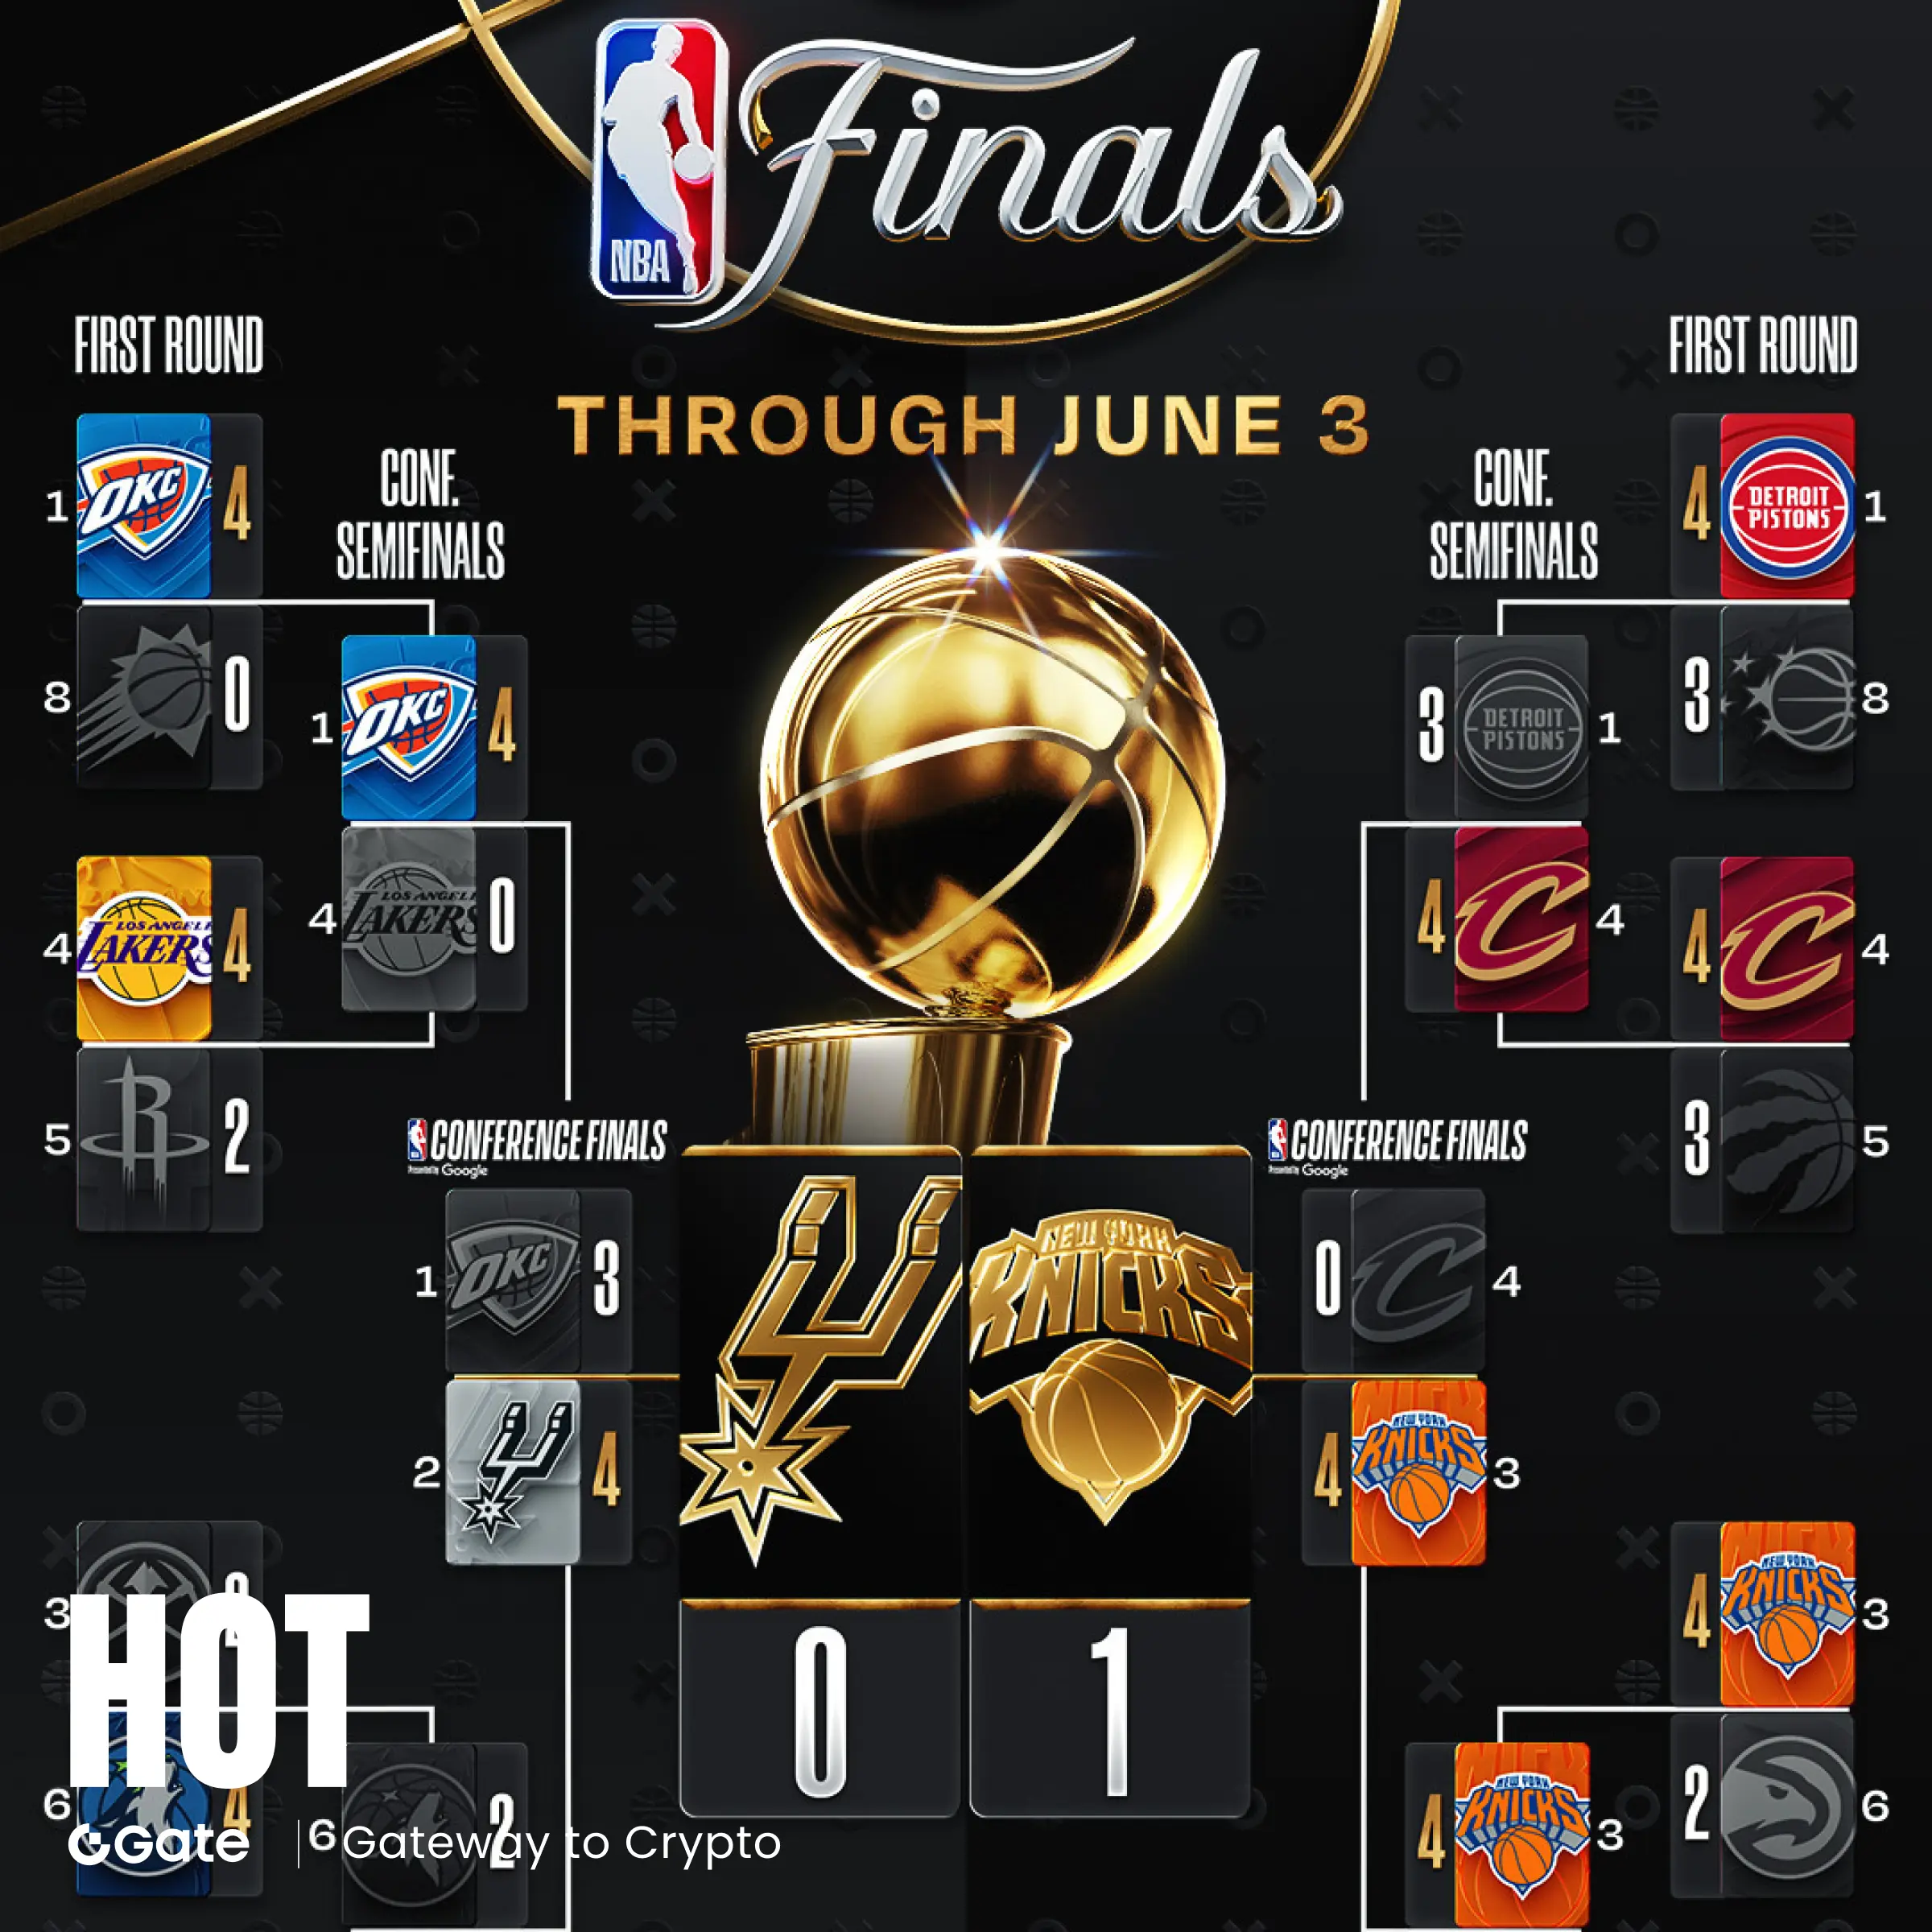
On the morning of June 4, 2026 (Beijing time), Game 1 of the 2026 NBA Finals kicked off at San Antonio’s Frost Bank Center, with the New York Knicks challenging the San Antonio Spurs on the road. In the first quarter, the Spurs finished the frame 27:19 thanks to Victor Wembanyama’s defensive intimidation and standout play from their reserve player Harper, who scored 10 points in the quarter. Knicks’ star guard Jalen Brunson left the court and returned to the locker room toward the end of the first quarter after a knee collision, briefly raising concerns among Knicks fans.
After Brunson returned in the second quarter, his condition limited him, but he still led the team in a determined rally. Spurs forward Champagnie hit five three-pointers in the first half, scoring 15 points to help San Antonio take a 55:48 lead into halftime. Brunson was 5-for-15 in the first half, and Wembanyama scored only 9 points in the first half—neither team’s core players were at their best.
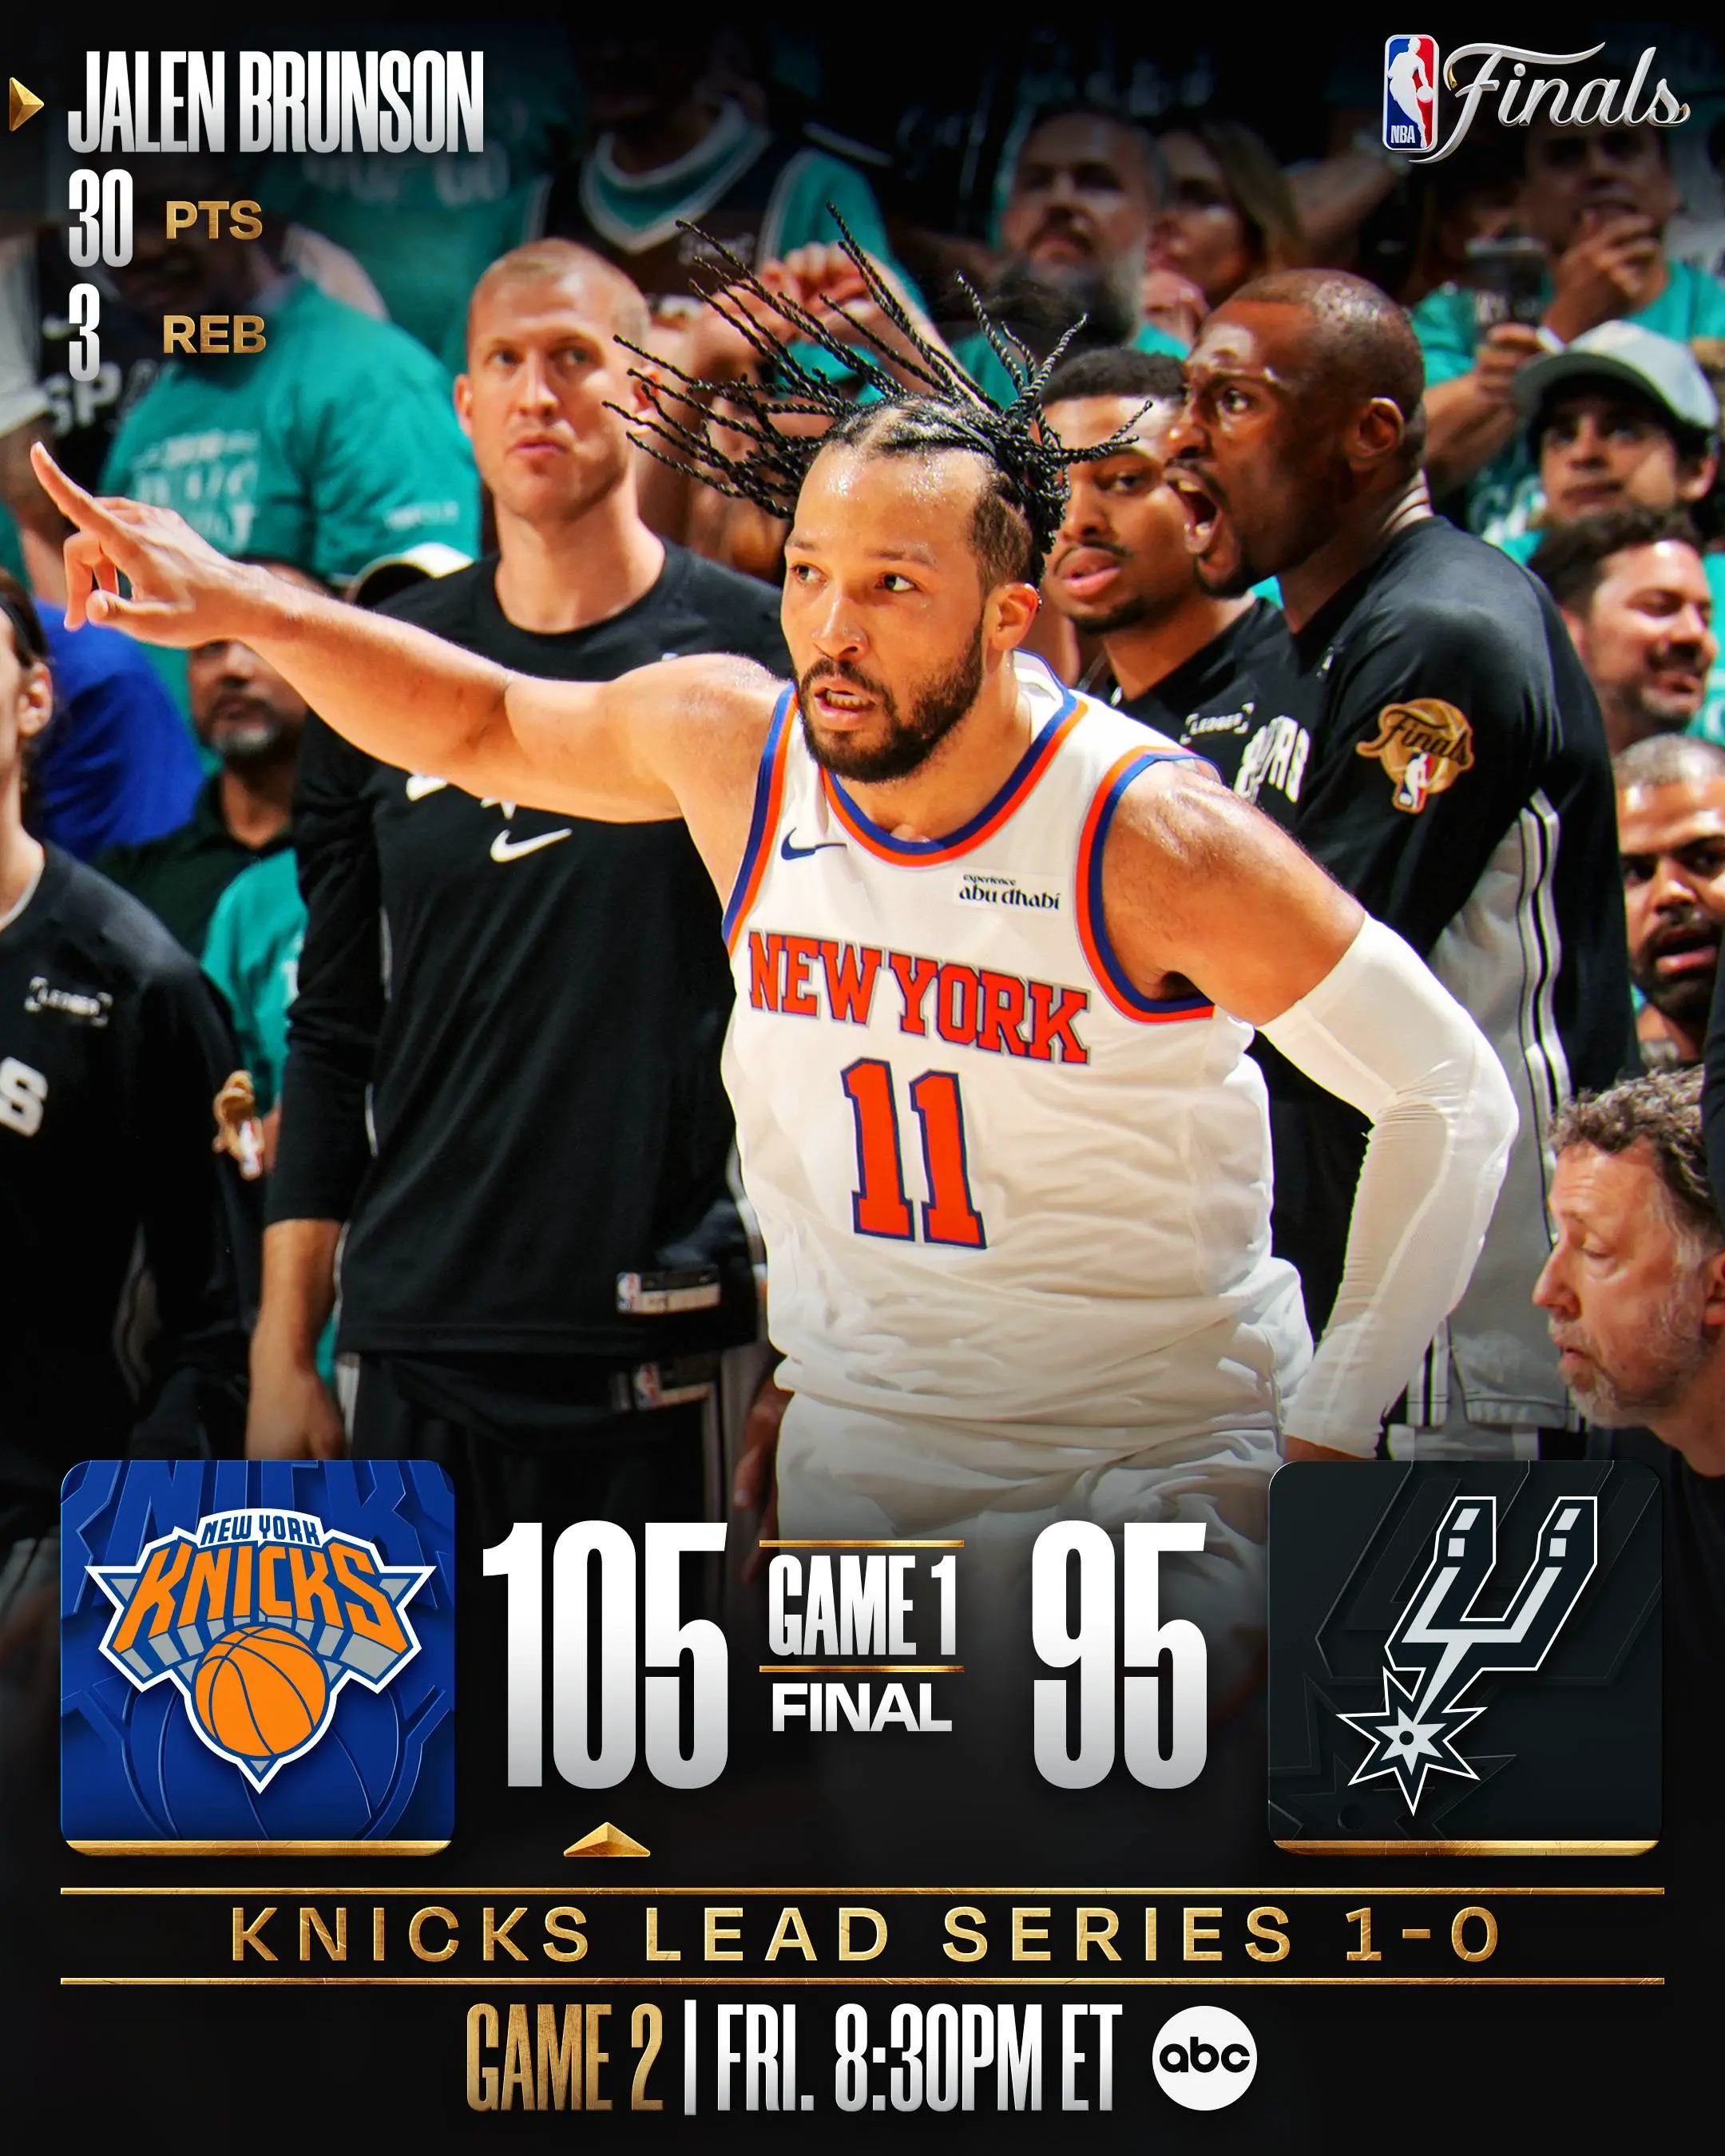
Photo: NBA
The third quarter became the turning point. The Spurs at one point expanded their lead to 14 points, but then the Knicks launched a fierce comeback. With Towns driving the charge, they went on a 22:9 run late in the quarter to pull the score to 76 even heading into the fourth. In the final-quarter showdown, Brunson took full control, scoring 13 points in the quarter. After the Spurs hit free throws, they went ahead 95:94, but Brunson immediately knocked down a crucial corner three to restore the Knicks’ lead. From then on, the Knicks closed it out with an 11:0 run to secure the win, with the final score settling at 105:95.
How did performances by Wembanyama and Brunson affect market pricing?
The outcome of Game 1 directly drove Gate’s prediction market implied odds for the championship to swing from the Spurs’ 64% vs the Knicks’ 36% pre-game to the Knicks’ 53% vs the Spurs’ 47%. This sharp adjustment is inseparable from the contrasting performances of the two teams’ core players.
Brunson finished with 30 points, 3 rebounds, and 2 assists. Although he went 12-for-31 overall and his first three quarters were sluggish, he came alive in the fourth—going 9-for-5 and scoring 13 points, including a corner three that flipped the game in the late stage. Even more notable, despite leaving the court with a knee injury in the first quarter and then being stepped on again due to an ankle collision in the second quarter, Brunson still pushed through. His mental toughness and execution at critical moments earned high recognition from the market.

Photo: NBA
By contrast, Spurs core Victor Wembanyama delivered 26 points, 12 rebounds, and 3 blocks in his Finals debut, but his offensive efficiency was worrying—he was 6-for-21 from the field, 2-for-9 from three, and committed 6 turnovers. After the game, Wembanyama admitted, “I played really badly tonight; nothing about it is more complicated than that.” The market also questioned his offensive stability while being systematically worn down by the Knicks’ interior unit (Towns and Mitchell Robinson), which is one of the key reasons the Spurs’ probability dropped sharply.
How does a prediction market dynamically integrate information from the game?
At the core of a prediction market is letting participants express their probability judgments by buying or selling contracts tied to whether an “event occurs.” The price itself represents the market’s overall probability expectation. The large fluctuation in odds before and after Game 1 shows how highly this mechanism is sensitive to on-court information flow.
During the game, the prediction market’s probabilities change second by second based on factors like the real-time score, player injury status, and performances of key players. When Brunson left with an injury in the first quarter, the Knicks’ championship probability may have dipped; when the Knicks later erupted in a comeback surge in the fourth quarter and ultimately reversed the result, the probability was quickly adjusted upward. After the final whistle, the market entered an information digestion period—trading volume surged significantly, and prices converged toward a new equilibrium.
This process also includes both information integration and trading behavior. The narrative impact of a comeback win attracts traders to place orders based on their judgment, and then the market undergoes a brief adjustment period. Once overreaction fades, the probability stabilizes at a level closer to true expectations. With the current 53% vs 47% distribution, it can be viewed as a temporary equilibrium after information absorption and market correction are completed.
Does the probability reversal after Game 1 have structural justification?
Is a probability adjustment of more than 30 percentage points caused by a single game reasonable (the Knicks up 17 percentage points, the Spurs down 17 percentage points)? The answer is that Game 1 released multiple structural signals.
First, home-court advantage changed hands. In a best-of-seven Finals, the team that wins the opening road game has a significantly higher chance of ultimately winning the championship. The Knicks not only reclaimed home-court advantage, but also forced the Spurs to win on the road to regain the initiative—an adjustment with long-term implications.
Second, the effectiveness of defensive strategy was validated. The Knicks limited the Spurs’ overall field goal percentage to 36% and used a strategy pairing Towns’ primary on-ball defense with weak-side help, forcing Wembanyama to perform far below the playoff average in terms of efficiency. This defensive plan proved effective at the highest intensity of play, meaning the Knicks have a repeatable framework for subsequent games.
Third, psychological advantage in key moments. The Knicks have already won 12 straight playoff games this season, making them the 7th team in NBA history to reach this mark. Their resilience and ability to handle big-game moments were further verified in Game 1. Meanwhile, the Spurs’ previous record of being perfect in their first six Finals appearances was broken, shifting the psychological balance decisively.
Prediction markets vs traditional analysis: what’s the difference in information aggregation efficiency?
Traditional sports event analysis relies mainly on expert forecasts, statistical models, and historical analogies. Prediction markets provide another kind of information aggregation mechanism, and its core advantage is that traders’ economic incentives are directly tied to outcomes. When participants use real assets to express their views, their judgments come with economic cost constraints. This encourages participants to handle information more cautiously and actively uncover signals that have not yet been widely recognized.
Compared with free, open expert commentary or social media discussion, the price signals in a prediction market include stronger authenticity verification. A insider who knows injury news, a quant analyst who systematically analyzes advanced data, and a veteran fan who closely tracks tactical adjustments for both teams—their dispersed information converges into the same price signal through buy-and-sell behavior.
For Gate users, observing how probabilities change in these prediction markets helps them sense the collective market judgment on sudden developments more promptly, instead of relying on delayed traditional media reports. The price discovery efficiency shown by the Game 1 reversal event is a typical example of a prediction market’s information aggregation capability.
From the NBA to the World Cup: expanding prediction-market scenarios
A prediction market’s pricing mechanism isn’t limited to basketball—it can be applied across all competitive sports. Currently the most watched event is the 2026 FIFA World Cup: it begins on June 11, hosted jointly by the United States, Mexico, and Canada. For the first time, the participating teams expand from 32 to 48, the total number of matches increases to 104, and the tournament format undergoes a historic change.
Gate’s prediction markets also launch a “Green Pitch Oracle” campaign to comprehensively cover predictions such as who wins the World Cup, single-match outcomes, and the top scorer. After users complete registration on the campaign page, they can receive 1 betting coupon for free. By completing trading tasks such as spot, contracts, CFDs, or VIP upgrades (reset on a weekly basis), users can claim more experience coupons and betting coupons. 活动链接
After obtaining the betting coupons, users can participate in prediction tasks for designated World Cup matches. Points are awarded based on the betting results, and users can chase rewards on the leaderboard and compete for the ultimate prize pool. For new users, the “Green Pitch Oracle” campaign offers a low-threshold experience: using experience coupons and betting coupons doesn’t require taking direct financial risk. Users can get familiar with how prediction markets work, understand the logic of how “Yes/No” share prices correspond to probabilities, and see how event outcomes influence market pricing.
FAQ
Q: How are probabilities formed in a prediction market?
A: The probabilities in a prediction market come directly from the contract trading price. For example, if the “Knicks to win the championship” contract currently trades at 0.53 USD (assuming the settlement price is 1 USD), then the market’s implied probability is 53%. This price is jointly determined by the buy and sell orders of all participants and reflects the collective judgment in real time.
Q: After the Game 1 reversal, the Knicks’ championship probability rose to 53%—does that mean the Knicks are now clear favorites?
A: 53% only indicates that, under the current information set, the market believes the Knicks have a slight advantage; the series still has a high degree of uncertainty. The results of each subsequent game may trigger further probability adjustments. Users should treat prediction-market data as a dynamic reference rather than a definite conclusion.
Q: Why did the market still cut the Spurs’ championship probability even though Wembanyama had 26 points and 12 rebounds?
A: The market focuses on efficiency rather than raw fundamentals. Wembanyama went 6-for-21 overall, with a field goal rate below 30%, and committed 6 turnovers. Under the Knicks’ interior defense, his offensive efficiency was far worse than the playoff average, which made the market worry about his subsequent performance.
Q: How can I get the latest data from Gate prediction markets?
A: Users can access the prediction market section on the Gate platform to view real-time probabilities and trading depth for the NBA Finals, the World Cup, and other popular events.

