Au 19 mai 2026, d’après les données de marché de Gate, ETH s’échange actuellement à 2 130 dollars, en hausse légèrement de 0,6% sur 24 heures. Dans le même temps, sur la plateforme de prédiction Polymarket, le contrat « À quel prix Ethereum atteindra-t-il en mai ? » est devenu l’un des événements de prédiction les plus suivis par le marché, avec un volume total des transactions dépassant 4 millions de dollars. Comprendre la distribution de probabilités sous-jacente à ce contrat et sa logique de tarification permet de saisir de manière plus complète la structure des anticipations du marché concernant la trajectoire à court terme de l’ETH.

Comment les contrats Polymarket tarifient des scénarios de prix pour l’ETH
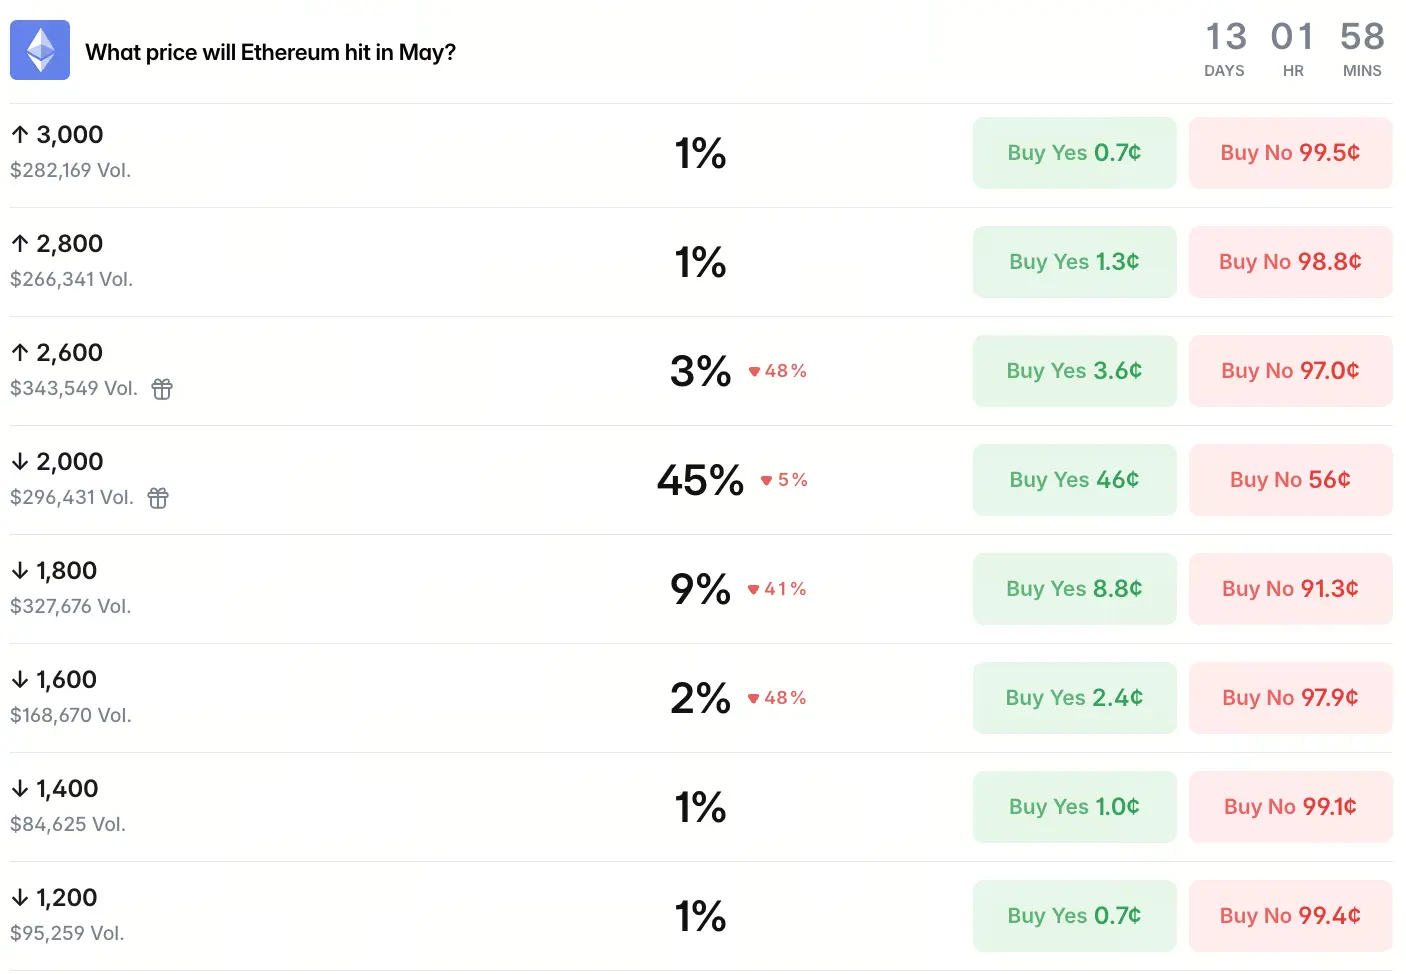
Source : Polymarket
Sur le marché de prédiction Polymarket « À quel prix Ethereum atteindra-t-il en mai ? », les traders attribuent, par leurs mises en argent réel, des probabilités aux différents niveaux de prix d’ici la fin du mois de mai. Au 19 mai, les données du marché Polymarket indiquent que la probabilité que les fonds parient une baisse sous 2 000 dollars est de 45%, celle d’une baisse sous 1 800 dollars est de 9%, celle d’une baisse sous 1 600 dollars est de 2% et celle d’une baisse sous 1 400 dollars est de 1%. À la hausse, la probabilité de franchir 2 600 dollars est de 3%, celle de franchir 2 800 dollars est de 1% et celle de franchir 3 000 dollars est de 1%.
La distribution globale des probabilités présente une structure nettement asymétrique : le marché estime que la principale hypothèse est que l’ETH reste dans l’intervalle actuel, mais les risques à la baisse sont également tarifés de manière approfondie.
Quelle divergence de marché la répartition des mises reflète-t-elle
D’après la structure de la distribution des probabilités, le marché ne s’est pas rassemblé autour d’un consensus haussier ou baissier, mais affiche au contraire une configuration typique de fragmentation. D’un côté, 68% de la probabilité implicite indiquent que l’ETH clôturera des transactions de mai au-dessus de 2 200 dollars, ce qui constitue l’« attente de référence » du marché. De l’autre, la probabilité de passer sous 2 000 dollars est de 45%, ce qui signifie que le risque de baisse est loin d’être négligeable et est significativement tarifé.
Les traders de Polymarket tarifient actuellement l’ETH selon trois dimensions :
- Du point de vue de la direction des prix, le marché se situe globalement dans une plage allant du range à une hausse modérée ;
- Du point de vue des flux de fonds ETF, la probabilité de flux entrants continus se situe autour de 60% à 70% ;
- Et du point de vue de la croissance du réseau, la probabilité implicite que l’adoption Layer-2 progresse se situe autour de 70% à 85%.
Ce cadre de tarification à trois dimensions montre que les traders ne se concentrent pas seulement sur l’évolution à court terme du prix de l’ETH, mais évaluent aussi de manière globale les mouvements de capitaux des institutions et les fondamentaux du réseau. Le point le plus marquant est que le marché de prédiction indique une probabilité de 56% pour que l’ETH atteigne 1 500 dollars au cours de 2026 : ce chiffre ne provient pas d’une hypothèse exploratoire basée sur un rapport de recherche, mais du résultat direct des mises du marché, reflétant des inquiétudes profondes des participants concernant l’environnement macro à moyen et long terme et la dynamique concurrentielle d’Ethereum.
Comment les flux de capitaux institutionnels influencent la logique de tarification des marchés de prédiction
L’allocation du capital institutionnel est l’une des variables clés qui influencent les anticipations du marché de l’ETH. D’après les flux des fonds des fonds négociés en bourse sur Ethereum (ETF), il y a eu un signal de retrait institutionnel notable en mai. Les ETF spot Ethereum ont enregistré, sur la semaine se terminant le 15 mai, environ 255 millions de dollars de sorties nettes, dont une sortie nette de 131 millions de dollars sur une seule journée le 12 mai, signalant un refroidissement temporaire de la demande institutionnelle. Cela contraste en partie avec la tarification de la dimension « flux de fonds ETF » sur Polymarket : le marché de prédiction conserve une probabilité relativement élevée pour des entrées de fonds continues, ce qui indique un écart entre les flux réels et les attentes du marché.
En même temps, les adresses de niveau « baleine » ont accumulé plus de 140 000 ETH dans la zone de support située entre 2 200 et 2 300 dollars, pour une valeur d’environ 322 millions de dollars, montrant une divergence directionnelle entre le « smart money » et les institutions. La confrontation entre ces macro-allocateurs et les gros acteurs on-chain est une raison structurelle importante qui maintient la volatilité à un niveau bas au sein de l’intervalle de prix actuel de l’ETH. La différence de nature des fonds signifie que les deux forces ne pousseront pas dans la même direction sur le même axe au même moment ; le marché manque donc de catalyseur pour une cassure unilatérale.
La structure de l’offre on-chain d’Ethereum soutient-elle l’intervalle de prix actuel
Même si le prix à court terme de l’ETH fait face à de multiples pressions au niveau macro, la structure de l’offre on-chain évolue vers un resserrement de long terme. À ce jour, environ 39 millions d’ETH sont verrouillés dans des contrats de staking, soit près d’un tiers de l’offre circulante totale, atteignant un niveau historique maximal. Cela signifie que la liquidité disponible à la négociation se contracte de manière systématique : une grande quantité d’ETH quitte l’état immédiatement vendable. La hausse continue du taux de staking crée un mécanisme de tampon naturel pour le prix : pendant une baisse, le stock d’ETH vendable diminue, ce qui, en théorie, limite la profondeur de la baisse du prix.
Cependant, les données les plus récentes de mai montrent que le rythme d’entrées nettes des fonds de staking a commencé à ralentir : le volume total staké, après une hausse continue, tend désormais vers un palier à un niveau élevé. Le ralentissement des entrées de staking est à la fois un signal de changement d’humeur du marché et potentiellement un déclencheur de l’amplification de la volatilité : à des niveaux de staking élevés, même de petites variations de la structure de l’offre peuvent amplifier l’ampleur des mouvements de prix lorsque des catalyseurs se déclenchent. De plus, la progression des rendements des bons du Trésor américain au-dessus de 4,6% réduit l’attrait des rendements du staking par rapport aux actifs traditionnels à revenu fixe, ce qui influence également, dans une certaine mesure, l’évaluation du marché sur la volonté de détenir de l’ETH.
Comment les politiques macro influencent le prix de l’ETH et la tarification des marchés de prédiction
L’effet des conditions de liquidité macro se répercute dans tout le récit du marché en 2026. La Réserve fédérale lors de sa réunion de politique monétaire de mars a maintenu le taux directeur entre 3,5% et 3,75%, tout en abaissant les anticipations du nombre de baisses de taux sur l’année. Un environnement de taux maintenus à un niveau élevé implique que le vent porteur de la liquidité pour le marché des cryptomonnaies faiblit, et que la volonté de faire entrer de nouveaux capitaux sur les actifs à haut risque en marge diminue. Les articles de recherche de la Fed indiquent que depuis 2021, la sensibilité d’actifs numériques majeurs comme Ethereum aux nouvelles macroéconomiques américaines, notamment les décisions de taux, les données d’inflation et l’emploi, n’a cessé d’augmenter ; son schéma de comportement se rapproche de plus en plus de celui des actions traditionnelles.
Le rapport sur le sentiment ETH de Polymarket montre que, généralement, les mises à jour liées aux ETF ou les actualités macro entraînent une variation de probabilité de 8% à 15%, tandis que la réaction aux grands événements macro peut atteindre 15% à 25% ou plus. Le mécanisme de transmission actuel du contexte macro vers l’ETH est clair : la variation des anticipations de taux influence les décisions d’allocation des institutions ; les entrées ou sorties de capitaux institutionnels agissent directement sur les prix via le canal des ETF ; puis la variation des anticipations de prix est convertie en expressions de probabilités via le trading des contrats du marché de prédiction. Cette structure de transmission en trois étages implique que tout changement d’anticipation concernant la trajectoire des taux est rapidement tarifé sur les contrats de prédiction liés à l’ETH.
Valeur sectorielle et limites des données des marchés de prédiction
Les plateformes de marchés de prédiction comme Polymarket ont connu une croissance rapide en 2026. Au premier trimestre 2026, le volume total des transactions de Polymarket atteint 26,2 milliards de dollars, soit une hausse de plus de 90% par rapport au trimestre précédent. Les volumes cumulés de transactions des marchés de prédiction et de Kalshi ont dépassé 150 milliards de dollars en avril ; l’industrie prévoit que le volume annuel pourrait atteindre 240 milliards de dollars sur l’ensemble de 2026.
Cependant, les données des marchés de prédiction présentent des limites intrinsèques qu’il faut vérifier lors de leur utilisation. D’un côté, le nombre d’utilisateurs actifs de trading sur la plateforme est passé de 733 000 en mars à environ 643 000, et le volume mensuel des transactions a pour la première fois diminué en glissement séquentiel. De l’autre, environ 82% des utilisateurs ont un montant de transaction par trimestre inférieur à 10 000 dollars ; le marché est donc principalement dominé par des capitaux de détail à petite échelle, plutôt que par des capitaux institutionnels. Cette structure d’utilisateurs implique que les signaux de probabilité des marchés de prédiction ressemblent davantage à un « thermomètre » de l’humeur des particuliers qu’à une cartographie précise de l’allocation de capital des institutions. Les données elles-mêmes sont factuelles, mais elles reflètent les convictions capitalisées d’un groupe spécifique ; elles doivent être croisées avec des informations issues d’autres dimensions telles que les données on-chain et les flux de fonds des ETF. Comprendre cela est une condition préalable à une utilisation correcte des données de marché de prédiction.
FAQ
Q : Quel est le volume total des transactions du contrat de prédiction du prix de l’ETH en mai sur Polymarket ?
D’après les données fournies par les utilisateurs, le volume total des transactions de ce contrat dépasse 4 millions de dollars.
Q : Les données de probabilité de Polymarket peuvent-elles être utilisées comme prévision de prix ?
Non. Les données de probabilité de Polymarket reflètent les croyances capitalisées d’un groupe de participants à un marché donné ; ce ne sont pas des outils de prédiction de prix et elles ne peuvent pas remplacer l’analyse technique ou la recherche fondamentale. Leur valeur centrale réside dans la mise en évidence de la distribution de probabilités subjective du marché pour un événement donné.
Q : Où se situent approximativement les zones de support et de résistance actuelles de l’ETH ?
D’après les données d’analyse du marché, le support immédiat de l’ETH se situe dans la fourchette de 2 050 à 2 100 dollars, avec des supports principaux autour de 1 900 à 1 850 dollars ; les résistances immédiates se situent entre 2 250 et 2 300 dollars, et une cassure forte de la résistance se situe entre 2 400 et 2 600 dollars.
Q : Que signifie l’augmentation du taux de staking pour la structure de l’offre de l’ETH ?
L’augmentation du taux de staking signifie qu’une grande quantité d’ETH est verrouillée dans des contrats de validateurs, ce qui réduit la liquidité négociable sur le marché. Au 19 mai, environ 39 millions d’ETH sont stakés, soit environ un tiers de l’offre circulante totale. Cela offre un tampon naturel au marché pour les prix, mais peut aussi amplifier la volatilité après stabilisation des taux de staking élevés.
Q : Pourquoi les deux chiffres de Polymarket, la probabilité de passer sous 2 000 dollars (45%) et celle de rester au-dessus de 2 200 dollars (68%), semblent-ils incohérents ?
Ces deux probabilités proviennent de fenêtres de temps différentes ou de dimensions de contrats différentes. 68% correspond à la probabilité implicite que l’ETH atteigne ou maintienne au moins 2 200 dollars d’ici le 31 mai ; 45% correspond à la probabilité implicite de « passer sous 2 000 dollars ». Les deux ne constituent pas un rapport de calcul direct ; elles décrivent la structure de la distribution des probabilités du marché sous des angles de fourchettes de prix différents.
