#MyGateTradeStory
#$LAB $LAB #LAB暴涨后回调63% LAB/USDT Market Review: After a parabolic 68x rally, is the distribution phase over, or is more pain ahead?
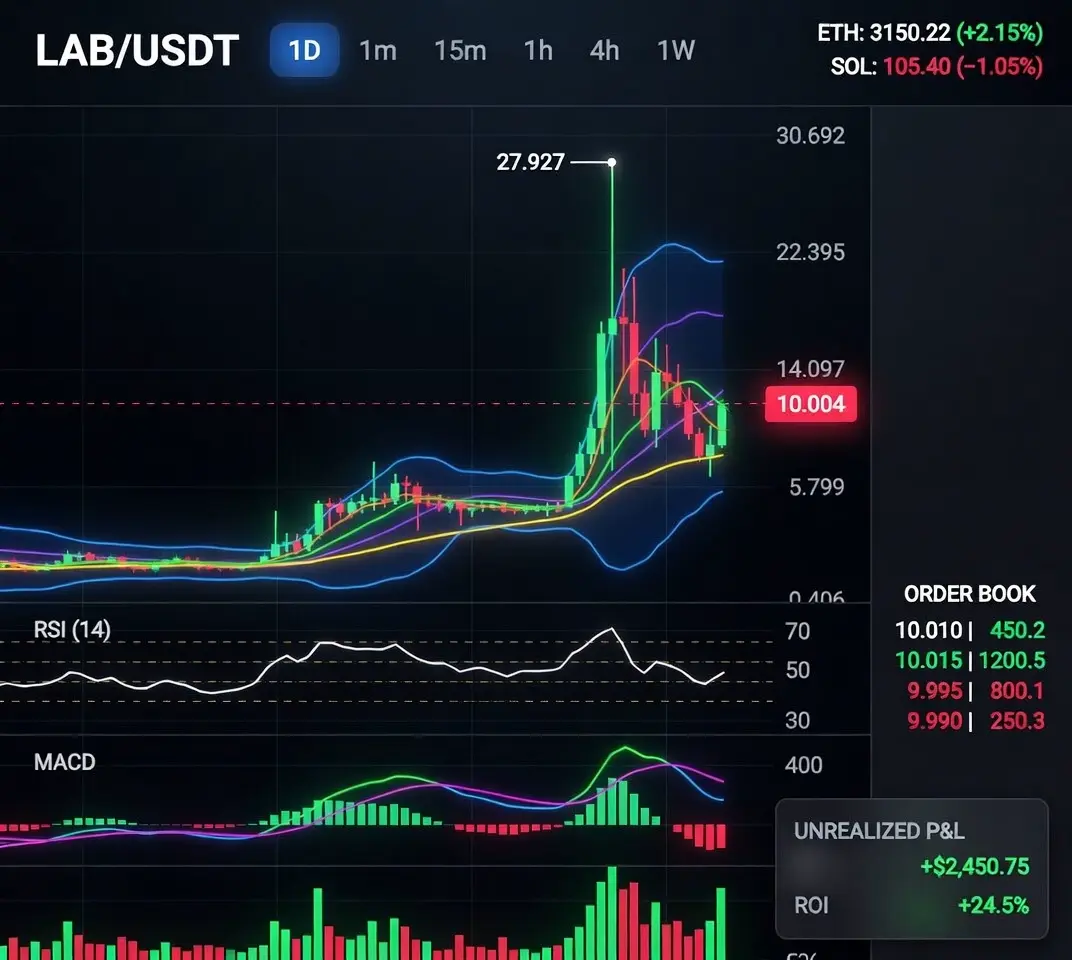
LAB/USDT is attempting stabilization at $10.081, up 30.91% in 24h, after a violent correction from the $27.927 all-time high printed on June 7. The rebound comes with 24h volume of 1.36M LAB and turnover of $12.33M, indicating that volatility remains elevated despite the drawdown.
From the daily chart, LAB delivered an extreme move. Price rallied from the $0.406 base in mid-April to $27.927 in under 60 days, a 6,778% gain. The subsequent correction was equally severe. As of June 12, LAB has retraced 63.9% from the peak, erasing nearly $1.8B in fully diluted market cap.
Technically, the structure is mixed. Price is currently caught between key moving averages: MA5 at $9.476 is providing short-term support, while MA10 at $11.199 now acts as immediate resistance. The longer-term MA30 at $7.906 remains well below price, showing the primary uptrend is not yet broken. However, MACD at -0.525 has crossed below the signal line, with DIF at 1.322 and DEA at 1.848, suggesting bearish momentum is still dominant despite today’s green candle.
The 24h range between $7.540 and $10.444 shows buyers defended the $7.5 zone, which aligns with the late-May consolidation area. This level also coincides with MA30. If MA30 fails, the next major structural support is near $5.799, the pre-breakout high from May 20. On the upside, reclaiming $11.199, the MA10, is the first step for bulls to regain control. A close above $14.097 would signal the correction may be complete.
As a DeFi sector token ranked No.10 in 24h heat, LAB’s volatility is amplified by leverage. LABUSDT Perp is up 31.68% at $10.12363, showing futures are leading spot. This divergence often occurs during high-volatility phases when traders use derivatives to express directional views with leverage.
The data indicates that early profit-taking was aggressive after the parabolic top. Volume bars during the decline from $27.9 to $10.0 exceeded the volume during the entire markup phase from $0.4 to $5.0. This is a classic sign of distribution. Yet, the 30% daily rebound on June 12 suggests short covering and dip buying are active.
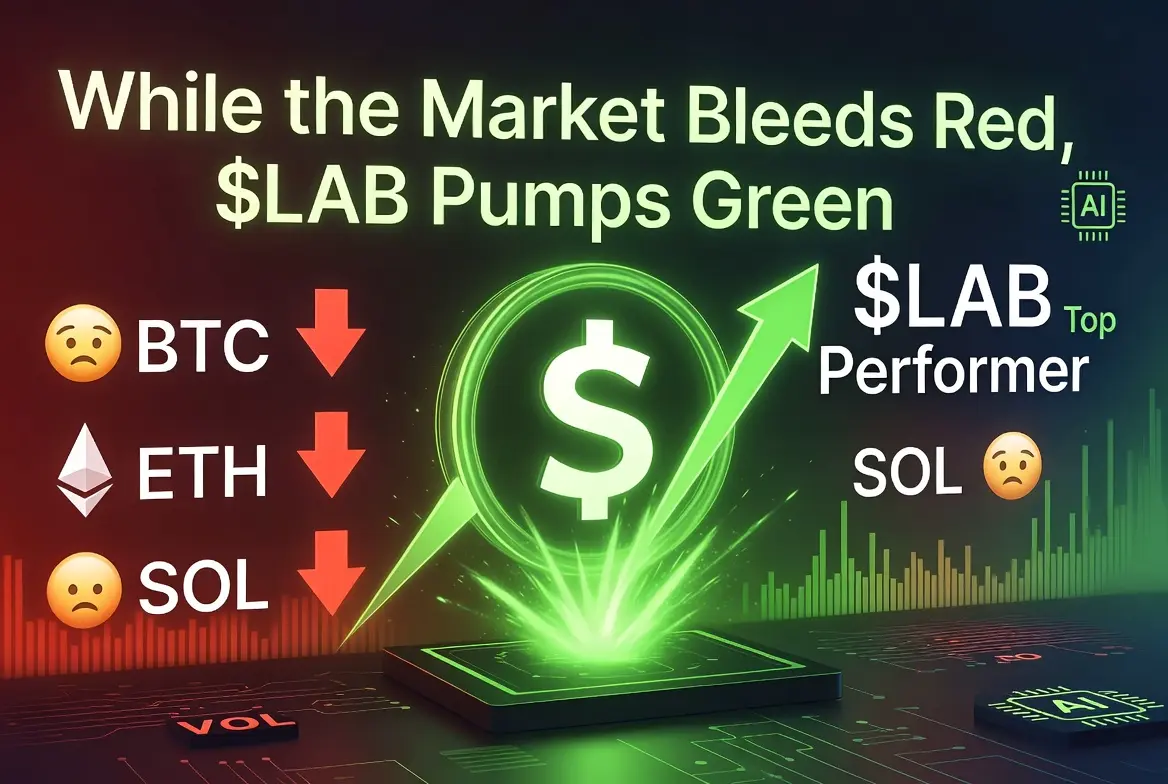
With AI and DeFi narratives rotating and risk appetite returning to altcoins, LAB’s high-beta nature makes it a liquidity magnet. But after a 6,700% move, valuations and unlock schedules become critical.
Is the current $10.0 level a healthy retest of the breakout zone before continuation, or has the speculative mania peaked with the $27.9 blow-off top?
#MyGateTradingMoment
#我的Gate交易时刻
#$LAB $LAB #LAB暴涨后回调63% LAB/USDT Market Review: After a parabolic 68x rally, is the distribution phase over, or is more pain ahead?
LAB/USDT is attempting stabilization at $10.081, up 30.91% in 24h, after a violent correction from the $27.927 all-time high printed on June 7. The rebound comes with 24h volume of 1.36M LAB and turnover of $12.33M, indicating that volatility remains elevated despite the drawdown.
From the daily chart, LAB delivered an extreme move. Price rallied from the $0.406 base in mid-April to $27.927 in under 60 days, a 6,778% gain. The subsequent correction was equally severe. As of June 12, LAB has retraced 63.9% from the peak, erasing nearly $1.8B in fully diluted market cap.
Technically, the structure is mixed. Price is currently caught between key moving averages: MA5 at $9.476 is providing short-term support, while MA10 at $11.199 now acts as immediate resistance. The longer-term MA30 at $7.906 remains well below price, showing the primary uptrend is not yet broken. However, MACD at -0.525 has crossed below the signal line, with DIF at 1.322 and DEA at 1.848, suggesting bearish momentum is still dominant despite today’s green candle.
The 24h range between $7.540 and $10.444 shows buyers defended the $7.5 zone, which aligns with the late-May consolidation area. This level also coincides with MA30. If MA30 fails, the next major structural support is near $5.799, the pre-breakout high from May 20. On the upside, reclaiming $11.199, the MA10, is the first step for bulls to regain control. A close above $14.097 would signal the correction may be complete.
As a DeFi sector token ranked No.10 in 24h heat, LAB’s volatility is amplified by leverage. LABUSDT Perp is up 31.68% at $10.12363, showing futures are leading spot. This divergence often occurs during high-volatility phases when traders use derivatives to express directional views with leverage.
The data indicates that early profit-taking was aggressive after the parabolic top. Volume bars during the decline from $27.9 to $10.0 exceeded the volume during the entire markup phase from $0.4 to $5.0. This is a classic sign of distribution. Yet, the 30% daily rebound on June 12 suggests short covering and dip buying are active.
With AI and DeFi narratives rotating and risk appetite returning to altcoins, LAB’s high-beta nature makes it a liquidity magnet. But after a 6,700% move, valuations and unlock schedules become critical.
Is the current $10.0 level a healthy retest of the breakout zone before continuation, or has the speculative mania peaked with the $27.9 blow-off top?
#MyGateTradingMoment
#我的Gate交易时刻