#AreYouBullishOrBearishToday?
Introduction: What Does This Question Really Mean for a Trader?
Every single morning, serious traders ask themselves one fundamental question before placing a single trade:
Are you Bullish or Bearish today?
Bullish = You believe prices will go UP. You are optimistic, confident, and ready to buy.
Bearish = You believe prices will go DOWN. You are cautious, defensive, or ready to sell/short.
This is not just a social media hashtag. It is the foundation of every trading decision you will make today. Get it wrong, and you trade against the market. Get it right, and the market becomes your partner.
Let us go through every important point — step by step, in full detail.
Where Is the Market Right Now? (Real-Time Snapshot)
Asset Current Price 24h Change 7-Day Change 30-Day Change
BTC $69,122 -0.88% +1.49% +1.00%
ETH $2,126 -1.12% -0.63% +6.70%
SOL $80.32 -2.61% -1.06% -5.45%
BNB $605.40 -0.24% -0.88% -4.60%
The first thing you notice: The market is bleeding red today. Every major asset is down. Not dramatically, but consistently. This consistency across all coins is not random — it tells a story.
The Fear & Greed Index — The Most Important Number Right Now
Crypto Fear & Greed Index: 11out of 100— EXTREME FEAR
This is critical. An index of 11 means the market is in full panic mode. People are frightened. Weak hands are selling. Emotions are running the show, not logic.
What does this mean for you?
Warren Buffett's famous rule applies perfectly here:
"Be fearful when others are greedy, and greedy when others are fearful."
When the index hits extreme fear (below 20), historically this zone has often marked medium-term market bottoms — not always immediately, but the risk-reward for buying begins to shift in the bull's favor. However, extreme fear can also mean the market continues to fall before recovering. Caution is required.
Technical Analysis — What Are the Charts Saying?
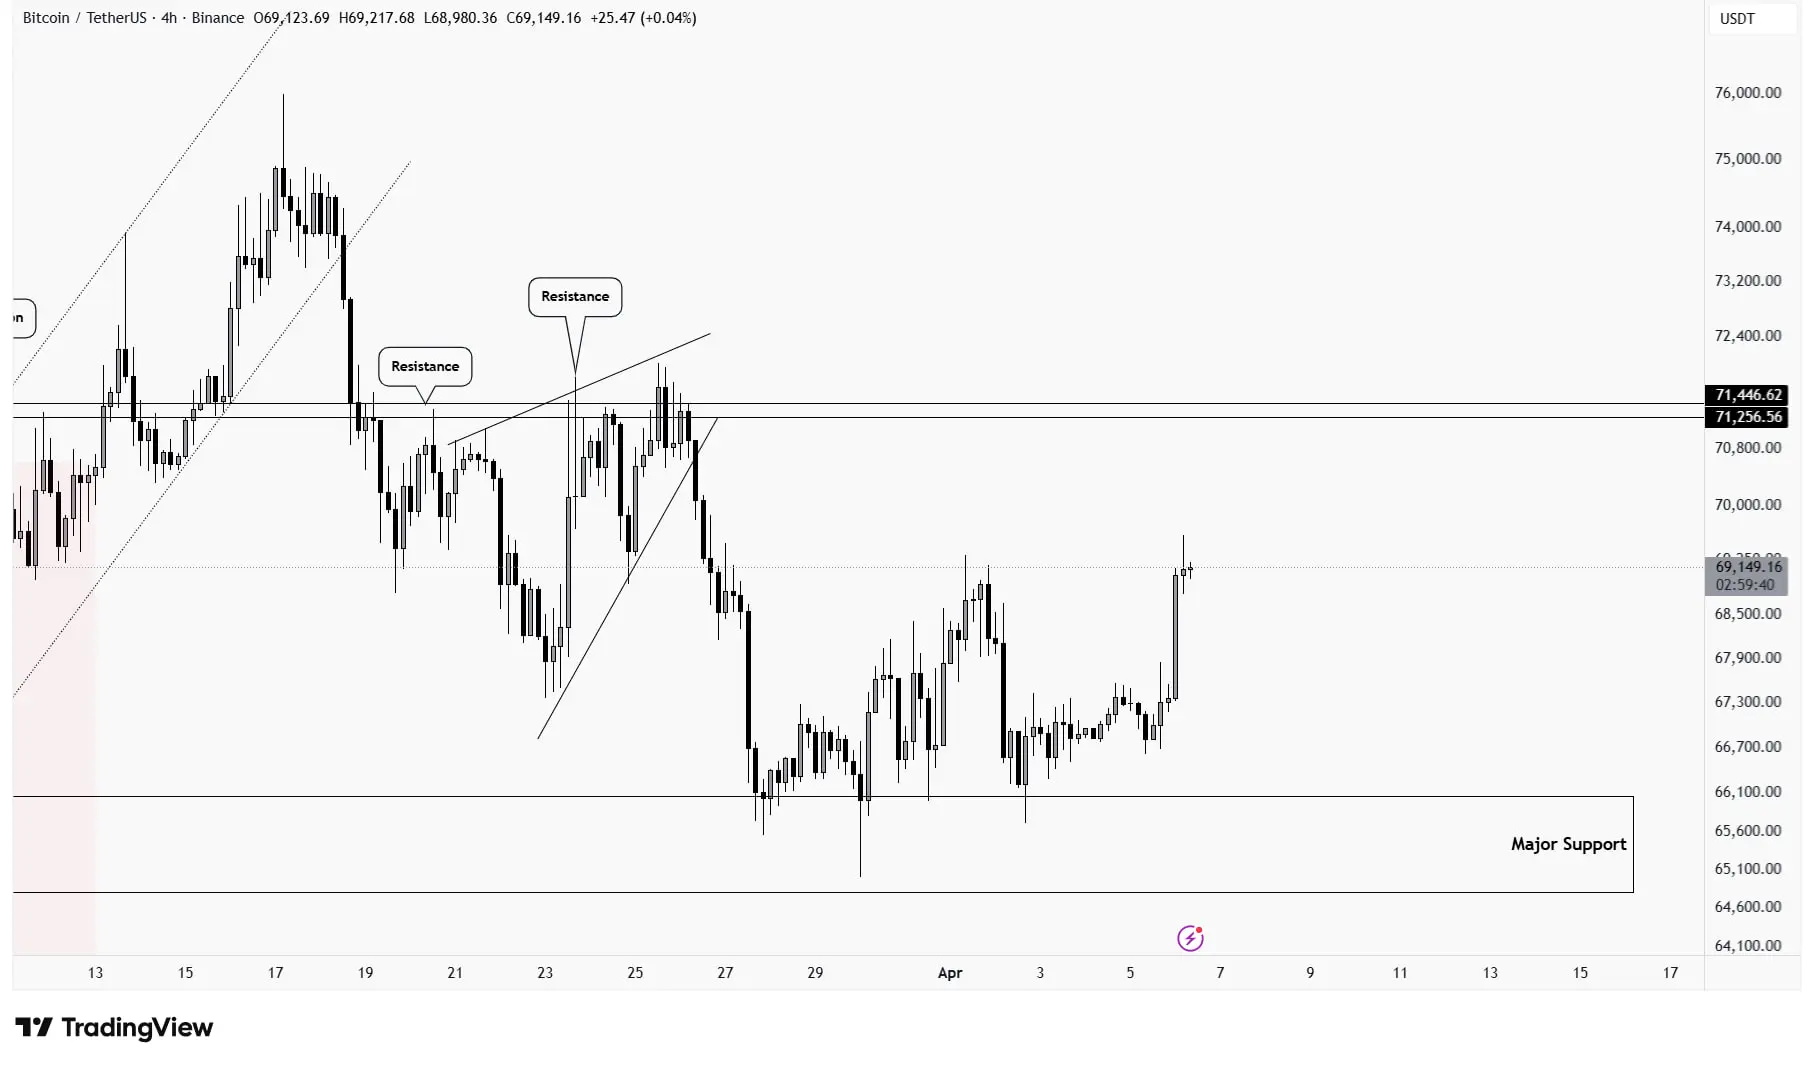
Bitcoin (BTC) — $69,122
Bullish signals:
Short-term (15-min, 4-hour) trend: PDI > MDI with ADX above 25— this means the upward trend is currently strong on short timeframes
RSI bottom divergence on the daily chart — price made a new low, but RSI did not. This is a classic reversal warning signal
MACD bottom divergence on the daily — same story, suggesting selling momentum is weakening
Price is holding above the 20-day moving average on the 15-min chart
Bearish signals:
Daily moving average arrangement: MA7 < MA30< MA120 — this is a textbook bearish alignment on the higher timeframe
4-hour MACD showing a top divergence — price made a new high but MACD weakened, warning of pullback
Bollinger Bands are squeezing (bandwidth at 30-day low) — a "coiling spring" situation: a big move is coming, but the direction is not yet confirmed
High volume on a down day = "panic selling" pattern confirmed
Verdict for BTC: Mixed — short-term signals are fighting against a larger bearish structure. The bottom divergences suggest a potential recovery, but the daily downtrend has not been broken yet.
Ethereum (ETH) — $2,126
Bullish signals:
Daily support confirmed around $2,100 — this level is holding
ETH Spot ETFs recorded $120.24 million net inflow on April 6alone
Bitmine now holds 4.8 million ETH (about 4% of total supply) — institutional accumulation is aggressive
ETH staking by the Ethereum Foundation approaching 70,000 ETH
Bearish signals:
ETH is underperforming BTC (-0.13% excess return vs BTC) — when altcoins underperform BTC in a down market, they tend to fall harder
Weekly ETF outflow data showed $206million leaving ETHA last week — institutional money is not unanimous
The daily MA structure is also bearish (MA7 < MA30 < MA120)
DARMA Capital co-founder just redeemed 60,000 staked ETH and sent it to an exchange — large sell pressure incoming
Verdict for ETH: Cautiously bearish short-term, with strong institutional accumulation providing a floor. The $2,100 zone is the line in the sand.
Solana (SOL) — $80.32
Bullish signals:
RSI and MACD bottom divergence visible on the daily — same as BTC, selling pressure may be fading
Circle minted $3.25 billion USDC on Solana in one week — massive liquidity entering the ecosystem
Galaxy Digital just launched SOL staking at6.5% APY for US customers
Bearish signals:
SOL is the worst performer today: -2.61% vs BTC's -0.88%
The Drift Protocol hack ($270-285 million stolen) severely damaged DeFi confidence on Solana
Daily MA in full bearish alignment
Discussion volume has dropped52% in the last 3 days compared to the previous3 days — the community is going quiet
Verdict for SOL: Bearish near-term. The hack has done reputational damage. Wait for clarity before entering.
BNB — $605.40
Bullish signals:
BNB is the strongest performer today — only -0.24% when BTC fell nearly 1%
BNB Chain now leads all crypto projects with 322.2 million token holders
World Liberty Financial launched AgentPay SDK on BNB Chain (AI + crypto integration)
Sentiment is 78% positive vs 11% negative — most bullish sentiment of all four assets today
Bearish signals:
The4-hour chart shows a head-and-shoulders pattern forming — a classic reversal warning
Daily Bollinger Bands at 30-day low bandwidth — uncertainty about next direction
90-day performance: -32% — the longer-term trend remains damaged
Verdict for BNB: Short-term relative strength, but the head-and-shoulders pattern is a serious risk. Watch for breakdown below $596.
News Catalysts Moving the Market Today
Institutional Buying (Bullish Pressure)
Strategy (MicroStrategy) just bought 4,871 BTC for $329.9 million — total holdings now 766,970 BTC. Michael Saylor is not stopping.
Polymarket is pricing a 91% probability that BTC returns to $70,000 in April
BTC ETFs: +$471.32 million net inflow on April 6 — largest since late February. Money is coming back in.
Selling Pressure (Bearish Pressure)
Multiple BTC mining companies (MARA, Riot, Nakamoto, Genius Group) have been selling BTC this quarter to cover operational costs
Anonymous wallets moved -6,000 BTC to exchanges — potential large sell orders in the pipeline
Security Concerns (Market Risk)
The Drift Protocol hack on Solana ($270-285 million stolen) has shaken confidence in DeFi broadly. The hacker used stolen funds to buy 130,000+ ETH — creating both artificial demand for ETH and panic across the Solana ecosystem.
Social Sentiment — What Is the Crowd Saying?
Coin Bullish Authors Bearish Authors Sentiment
BTC 77 (61%) 30 (24%) Net Bullish
ETH 20 (57%) 4 (11%) Mixed / Lean Bullish
SOL 53% positive posts 25% negative Net Bullish but cooling
BNB 78% positive posts 11% negative Strongly Bullish
The crowd is mostly bullish in terms of opinion — but they are trading in extreme fear. This disconnect between "what people say" and "how people act" is very typical of market bottoms. People talk bullish but sell anyway, out of fear.
The Verdict — Bullish or Bearish Today?
Overall Market Stance: CAUTIOUSLY BEARISH with Bullish Setup Building
Let me be direct and specific:
Short-term (today, next 24-48 hours): BEARISH
All four major assets are declining
Fear index at 11 — panic is real
Volume is rising on down candles (panic selling confirmed)
Daily moving averages in bearish alignment across the board
Large whale wallets moving BTC to exchanges
Medium-term (next 2-4 weeks): SHIFTING TO BULLISH
Bottom divergences on BTC and SOL daily charts suggest the selling is losing momentum
ETF inflows ($471M in one day) show institutional accumulation is strong
Strategy continues buying aggressively
BTC holding the $68,000-69,000 support zone
Bollinger Band squeeze means a big move is coming — and the divergence signals favor upward resolution
Trading Strategy Plans — What to Actually Do
Strategy 1: The Cautious Accumulator (For Bullish Traders)
Do NOT rush in with full position — extreme fear markets can extend further before recovering
Use Dollar-Cost Averaging (DCA): Buy 20-25% of your intended position now, then add more if price drops to $67,000 and $65,000
Target assets: BTC first (strongest institutional support), then BNB (relative strength today)
Stop-loss: Daily close below $65,000 for BTC invalidates the bottom divergence thesis
Profit target zone: $72,000-75,000 (first resistance), $78,000-80,000 (second target)
Strategy 2: The Defensive Holder (For Those Already In)
If you are holding BTC: hold, but set a stop at $65,000
If you are holding SOL: reduce exposure by 30-40% until the Drift hack situation clarifies
If you are holding ETH: hold the $2,100 support — if it breaks, reduce position
Move part of your portfolio to stablecoins (USDT) to maintain dry powder for buying opportunities
Strategy 3: The Short-Term Trader (Bearish Plays)
The4-hour MACD top divergence on BTC suggests a short-term pullback from the $69,000-70,000 zone
A short trade with entry at $69,500-70,000, stop above $71,000, and target $67,500is a reasonable setup
BNB head-and-shoulders pattern: short below $596, target $580, stop above $612
Risk management is critical — do not over-leverage in extreme fear conditions
Strategy 4: The Sideline Observer (For the Patient)
If you are not in a trade yet, there is absolutely nothing wrong with waiting
Extreme fear at level 11 often precedes a recovery — but it can also precede further drops
Wait for one of these confirmations before entering:
1. BTC closes a daily candle above $71,000 (bullish momentum confirmed)
2. Fear & Greed Index recovers above 25-30 (fear is fading)
3. ETF inflows sustain above $300 million per day for 3+ consecutive days
Risk Management Rules — Never Forget These
No matter which strategy you choose, these rules apply every single time:
1. Never risk more than 1-2% of your total portfolio on a single trade
2. Always set a stop-loss before entering — not after
3. Do not trade on emotion — extreme fear is designed to make you panic-sell the bottom
4. Do not chase green candles — if you missed the entry, wait for the next one
5. Size down in high-fear environments — smaller position, survive longer
6. Keep20-30% in stablecoins always — dry powder is your best friend in volatile markets
Final Conclusion: Today's Answer to the Question
Are you Bullish or Bearish today?
The honest, data-driven answer is:
Bearish short-term, Bullish medium-term.
The market is scared. The indicators show panic. But beneath the surface, the big players — institutions, ETFs, Strategy — are quietly accumulating. The divergences on BTC and SOL are whispering that the selling may be nearing exhaustion. The Fear Index at 11 is historically a zone where patient, disciplined buyers are rewarded — not immediately, but over the coming weeks.
The worst traders today will panic-sell into the red. The best traders today will stay calm, protect their capital, and position carefully for the recovery that the data suggests is building.
Introduction: What Does This Question Really Mean for a Trader?
Every single morning, serious traders ask themselves one fundamental question before placing a single trade:
Are you Bullish or Bearish today?
Bullish = You believe prices will go UP. You are optimistic, confident, and ready to buy.
Bearish = You believe prices will go DOWN. You are cautious, defensive, or ready to sell/short.
This is not just a social media hashtag. It is the foundation of every trading decision you will make today. Get it wrong, and you trade against the market. Get it right, and the market becomes your partner.
Let us go through every important point — step by step, in full detail.
Where Is the Market Right Now? (Real-Time Snapshot)
Asset Current Price 24h Change 7-Day Change 30-Day Change
BTC $69,122 -0.88% +1.49% +1.00%
ETH $2,126 -1.12% -0.63% +6.70%
SOL $80.32 -2.61% -1.06% -5.45%
BNB $605.40 -0.24% -0.88% -4.60%
The first thing you notice: The market is bleeding red today. Every major asset is down. Not dramatically, but consistently. This consistency across all coins is not random — it tells a story.
The Fear & Greed Index — The Most Important Number Right Now
Crypto Fear & Greed Index: 11out of 100— EXTREME FEAR
This is critical. An index of 11 means the market is in full panic mode. People are frightened. Weak hands are selling. Emotions are running the show, not logic.
What does this mean for you?
Warren Buffett's famous rule applies perfectly here:
"Be fearful when others are greedy, and greedy when others are fearful."
When the index hits extreme fear (below 20), historically this zone has often marked medium-term market bottoms — not always immediately, but the risk-reward for buying begins to shift in the bull's favor. However, extreme fear can also mean the market continues to fall before recovering. Caution is required.
Technical Analysis — What Are the Charts Saying?
Bitcoin (BTC) — $69,122
Bullish signals:
Short-term (15-min, 4-hour) trend: PDI > MDI with ADX above 25— this means the upward trend is currently strong on short timeframes
RSI bottom divergence on the daily chart — price made a new low, but RSI did not. This is a classic reversal warning signal
MACD bottom divergence on the daily — same story, suggesting selling momentum is weakening
Price is holding above the 20-day moving average on the 15-min chart
Bearish signals:
Daily moving average arrangement: MA7 < MA30< MA120 — this is a textbook bearish alignment on the higher timeframe
4-hour MACD showing a top divergence — price made a new high but MACD weakened, warning of pullback
Bollinger Bands are squeezing (bandwidth at 30-day low) — a "coiling spring" situation: a big move is coming, but the direction is not yet confirmed
High volume on a down day = "panic selling" pattern confirmed
Verdict for BTC: Mixed — short-term signals are fighting against a larger bearish structure. The bottom divergences suggest a potential recovery, but the daily downtrend has not been broken yet.
Ethereum (ETH) — $2,126
Bullish signals:
Daily support confirmed around $2,100 — this level is holding
ETH Spot ETFs recorded $120.24 million net inflow on April 6alone
Bitmine now holds 4.8 million ETH (about 4% of total supply) — institutional accumulation is aggressive
ETH staking by the Ethereum Foundation approaching 70,000 ETH
Bearish signals:
ETH is underperforming BTC (-0.13% excess return vs BTC) — when altcoins underperform BTC in a down market, they tend to fall harder
Weekly ETF outflow data showed $206million leaving ETHA last week — institutional money is not unanimous
The daily MA structure is also bearish (MA7 < MA30 < MA120)
DARMA Capital co-founder just redeemed 60,000 staked ETH and sent it to an exchange — large sell pressure incoming
Verdict for ETH: Cautiously bearish short-term, with strong institutional accumulation providing a floor. The $2,100 zone is the line in the sand.
Solana (SOL) — $80.32
Bullish signals:
RSI and MACD bottom divergence visible on the daily — same as BTC, selling pressure may be fading
Circle minted $3.25 billion USDC on Solana in one week — massive liquidity entering the ecosystem
Galaxy Digital just launched SOL staking at6.5% APY for US customers
Bearish signals:
SOL is the worst performer today: -2.61% vs BTC's -0.88%
The Drift Protocol hack ($270-285 million stolen) severely damaged DeFi confidence on Solana
Daily MA in full bearish alignment
Discussion volume has dropped52% in the last 3 days compared to the previous3 days — the community is going quiet
Verdict for SOL: Bearish near-term. The hack has done reputational damage. Wait for clarity before entering.
BNB — $605.40
Bullish signals:
BNB is the strongest performer today — only -0.24% when BTC fell nearly 1%
BNB Chain now leads all crypto projects with 322.2 million token holders
World Liberty Financial launched AgentPay SDK on BNB Chain (AI + crypto integration)
Sentiment is 78% positive vs 11% negative — most bullish sentiment of all four assets today
Bearish signals:
The4-hour chart shows a head-and-shoulders pattern forming — a classic reversal warning
Daily Bollinger Bands at 30-day low bandwidth — uncertainty about next direction
90-day performance: -32% — the longer-term trend remains damaged
Verdict for BNB: Short-term relative strength, but the head-and-shoulders pattern is a serious risk. Watch for breakdown below $596.
News Catalysts Moving the Market Today
Institutional Buying (Bullish Pressure)
Strategy (MicroStrategy) just bought 4,871 BTC for $329.9 million — total holdings now 766,970 BTC. Michael Saylor is not stopping.
Polymarket is pricing a 91% probability that BTC returns to $70,000 in April
BTC ETFs: +$471.32 million net inflow on April 6 — largest since late February. Money is coming back in.
Selling Pressure (Bearish Pressure)
Multiple BTC mining companies (MARA, Riot, Nakamoto, Genius Group) have been selling BTC this quarter to cover operational costs
Anonymous wallets moved -6,000 BTC to exchanges — potential large sell orders in the pipeline
Security Concerns (Market Risk)
The Drift Protocol hack on Solana ($270-285 million stolen) has shaken confidence in DeFi broadly. The hacker used stolen funds to buy 130,000+ ETH — creating both artificial demand for ETH and panic across the Solana ecosystem.
Social Sentiment — What Is the Crowd Saying?
Coin Bullish Authors Bearish Authors Sentiment
BTC 77 (61%) 30 (24%) Net Bullish
ETH 20 (57%) 4 (11%) Mixed / Lean Bullish
SOL 53% positive posts 25% negative Net Bullish but cooling
BNB 78% positive posts 11% negative Strongly Bullish
The crowd is mostly bullish in terms of opinion — but they are trading in extreme fear. This disconnect between "what people say" and "how people act" is very typical of market bottoms. People talk bullish but sell anyway, out of fear.
The Verdict — Bullish or Bearish Today?
Overall Market Stance: CAUTIOUSLY BEARISH with Bullish Setup Building
Let me be direct and specific:
Short-term (today, next 24-48 hours): BEARISH
All four major assets are declining
Fear index at 11 — panic is real
Volume is rising on down candles (panic selling confirmed)
Daily moving averages in bearish alignment across the board
Large whale wallets moving BTC to exchanges
Medium-term (next 2-4 weeks): SHIFTING TO BULLISH
Bottom divergences on BTC and SOL daily charts suggest the selling is losing momentum
ETF inflows ($471M in one day) show institutional accumulation is strong
Strategy continues buying aggressively
BTC holding the $68,000-69,000 support zone
Bollinger Band squeeze means a big move is coming — and the divergence signals favor upward resolution
Trading Strategy Plans — What to Actually Do
Strategy 1: The Cautious Accumulator (For Bullish Traders)
Do NOT rush in with full position — extreme fear markets can extend further before recovering
Use Dollar-Cost Averaging (DCA): Buy 20-25% of your intended position now, then add more if price drops to $67,000 and $65,000
Target assets: BTC first (strongest institutional support), then BNB (relative strength today)
Stop-loss: Daily close below $65,000 for BTC invalidates the bottom divergence thesis
Profit target zone: $72,000-75,000 (first resistance), $78,000-80,000 (second target)
Strategy 2: The Defensive Holder (For Those Already In)
If you are holding BTC: hold, but set a stop at $65,000
If you are holding SOL: reduce exposure by 30-40% until the Drift hack situation clarifies
If you are holding ETH: hold the $2,100 support — if it breaks, reduce position
Move part of your portfolio to stablecoins (USDT) to maintain dry powder for buying opportunities
Strategy 3: The Short-Term Trader (Bearish Plays)
The4-hour MACD top divergence on BTC suggests a short-term pullback from the $69,000-70,000 zone
A short trade with entry at $69,500-70,000, stop above $71,000, and target $67,500is a reasonable setup
BNB head-and-shoulders pattern: short below $596, target $580, stop above $612
Risk management is critical — do not over-leverage in extreme fear conditions
Strategy 4: The Sideline Observer (For the Patient)
If you are not in a trade yet, there is absolutely nothing wrong with waiting
Extreme fear at level 11 often precedes a recovery — but it can also precede further drops
Wait for one of these confirmations before entering:
1. BTC closes a daily candle above $71,000 (bullish momentum confirmed)
2. Fear & Greed Index recovers above 25-30 (fear is fading)
3. ETF inflows sustain above $300 million per day for 3+ consecutive days
Risk Management Rules — Never Forget These
No matter which strategy you choose, these rules apply every single time:
1. Never risk more than 1-2% of your total portfolio on a single trade
2. Always set a stop-loss before entering — not after
3. Do not trade on emotion — extreme fear is designed to make you panic-sell the bottom
4. Do not chase green candles — if you missed the entry, wait for the next one
5. Size down in high-fear environments — smaller position, survive longer
6. Keep20-30% in stablecoins always — dry powder is your best friend in volatile markets
Final Conclusion: Today's Answer to the Question
Are you Bullish or Bearish today?
The honest, data-driven answer is:
Bearish short-term, Bullish medium-term.
The market is scared. The indicators show panic. But beneath the surface, the big players — institutions, ETFs, Strategy — are quietly accumulating. The divergences on BTC and SOL are whispering that the selling may be nearing exhaustion. The Fear Index at 11 is historically a zone where patient, disciplined buyers are rewarded — not immediately, but over the coming weeks.
The worst traders today will panic-sell into the red. The best traders today will stay calm, protect their capital, and position carefully for the recovery that the data suggests is building.