#MyGateTradeStory
SpaceX Trading Analysis and Strategy Guide
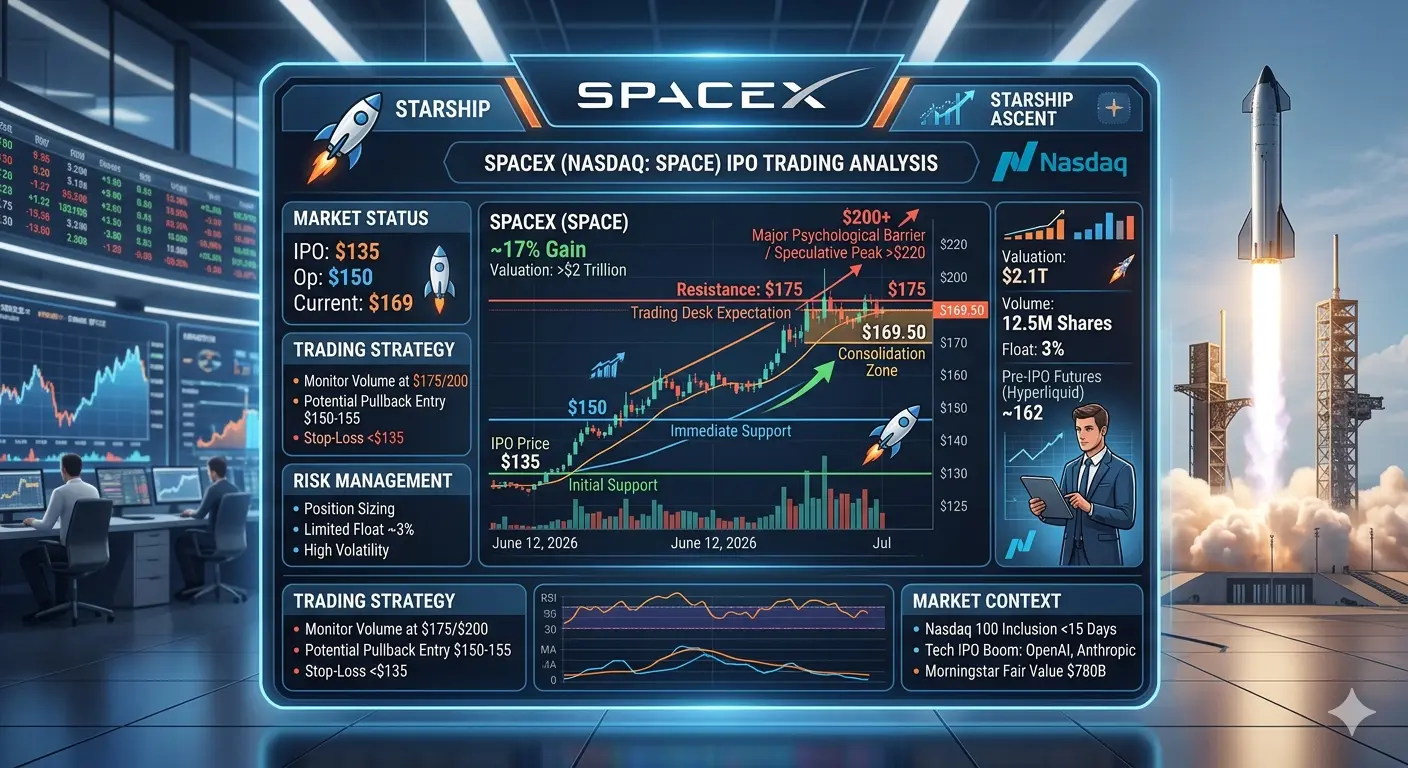
SpaceX has officially debuted on the Nasdaq on June 12, 2026, marking one of the most significant IPO events in market history. The stock opened at $150 per share, representing an 11% gain over its IPO price of $135. During midday trading, shares surged approximately 17%, pushing the company's valuation beyond $2 trillion. This remarkable debut officially crowns Elon Musk as the first trillionaire on record.
Current Market Status
The IPO was priced at $135 per share, giving SpaceX an initial valuation of $1.77 trillion. However, pre-IPO perpetual futures on platforms like Hyperliquid had been trading around $162, about 20% above the IPO price. These futures had previously peaked above $220 shortly after their May launch, indicating strong speculative interest. The actual opening at $150 and subsequent rally to approximately $169 aligns with elevated market expectations but remains below the speculative peaks seen in derivative markets.
Key Support and Resistance Levels
Based on the trading data and market structure, critical technical levels emerge for traders to monitor. The IPO price of $135 serves as a major psychological support level. The opening price of $150 represents immediate support, as this was where initial public demand materialized. Current trading around $169-$170 places the stock in a consolidation zone.
Resistance levels to watch include the $175 mark, which was initially indicated to trading desks before the official open. Beyond that, the $200 level represents a significant psychological barrier that trading desks had anticipated as a potential target. The pre-IPO futures peak above $220 suggests that extreme bullish sentiment could push prices toward this zone if momentum continues.
Trading Strategy Considerations
For traders looking to participate in SpaceX price action, several strategic approaches warrant consideration. Given the stock opened at $150 and rallied to current levels near $169, early momentum has been strong. However, the gap between the IPO price and current trading levels suggests that some profit-taking pressure could emerge.
Short-term traders might consider that the stock has already moved significantly from its IPO price, and the risk-reward ratio at current levels may be less favorable for new long positions. The trading desk expectations of reaching $200 provide an upside target, but the path there may involve volatility and potential pullbacks.
Risk management becomes particularly important given the stock's recent launch and limited trading history. Position sizing should reflect the inherent uncertainty in a newly public company, especially one with such a massive valuation. The relatively small float of approximately 3% of shares could contribute to heightened volatility as supply remains constrained.
Market Context and External Factors
SpaceX's debut occurs within a broader context of significant IPO activity, with companies like Anthropic and OpenAI also having filed prospectuses recently. This suggests a window of enthusiasm for high-profile technology offerings. However, analyst opinions vary significantly regarding valuation. Morningstar initiated coverage with a fair value estimate of $780 billion, less than half the IPO target, citing concerns about overvaluation. Conversely, Polymarket traders indicated an 84% probability that SpaceX would close above $1.8 trillion market capitalization.
The inclusion of SpaceX in the Nasdaq 100 Index is expected within 15 trading days after the IPO, which could drive additional passive investment flows. This technical factor may provide underlying support for the stock price as index-tracking funds build positions.
Practical Trading Recommendations
Traders should establish clear entry and exit points before initiating positions. For those considering long positions, waiting for a pullback toward the $150-$155 range could offer better risk-adjusted entry opportunities. Stop-loss orders should be placed below the IPO price of $135 to protect against significant downside moves.
For short-term trading, monitoring volume patterns and price action around the $175 and $200 resistance levels will be crucial. Breakouts above these levels with strong volume could signal continuation of the uptrend, while rejections may indicate the need for consolidation.
The stock's behavior in the coming trading sessions will establish important reference points for future technical analysis. Given that this is the first trading day, price discovery remains ongoing, and volatility should be expected. Traders should remain flexible and prepared to adjust strategies as more data becomes available and as the stock establishes its trading range.
@Gate_Square
SpaceX Trading Analysis and Strategy Guide
SpaceX has officially debuted on the Nasdaq on June 12, 2026, marking one of the most significant IPO events in market history. The stock opened at $150 per share, representing an 11% gain over its IPO price of $135. During midday trading, shares surged approximately 17%, pushing the company's valuation beyond $2 trillion. This remarkable debut officially crowns Elon Musk as the first trillionaire on record.
Current Market Status
The IPO was priced at $135 per share, giving SpaceX an initial valuation of $1.77 trillion. However, pre-IPO perpetual futures on platforms like Hyperliquid had been trading around $162, about 20% above the IPO price. These futures had previously peaked above $220 shortly after their May launch, indicating strong speculative interest. The actual opening at $150 and subsequent rally to approximately $169 aligns with elevated market expectations but remains below the speculative peaks seen in derivative markets.
Key Support and Resistance Levels
Based on the trading data and market structure, critical technical levels emerge for traders to monitor. The IPO price of $135 serves as a major psychological support level. The opening price of $150 represents immediate support, as this was where initial public demand materialized. Current trading around $169-$170 places the stock in a consolidation zone.
Resistance levels to watch include the $175 mark, which was initially indicated to trading desks before the official open. Beyond that, the $200 level represents a significant psychological barrier that trading desks had anticipated as a potential target. The pre-IPO futures peak above $220 suggests that extreme bullish sentiment could push prices toward this zone if momentum continues.
Trading Strategy Considerations
For traders looking to participate in SpaceX price action, several strategic approaches warrant consideration. Given the stock opened at $150 and rallied to current levels near $169, early momentum has been strong. However, the gap between the IPO price and current trading levels suggests that some profit-taking pressure could emerge.
Short-term traders might consider that the stock has already moved significantly from its IPO price, and the risk-reward ratio at current levels may be less favorable for new long positions. The trading desk expectations of reaching $200 provide an upside target, but the path there may involve volatility and potential pullbacks.
Risk management becomes particularly important given the stock's recent launch and limited trading history. Position sizing should reflect the inherent uncertainty in a newly public company, especially one with such a massive valuation. The relatively small float of approximately 3% of shares could contribute to heightened volatility as supply remains constrained.
Market Context and External Factors
SpaceX's debut occurs within a broader context of significant IPO activity, with companies like Anthropic and OpenAI also having filed prospectuses recently. This suggests a window of enthusiasm for high-profile technology offerings. However, analyst opinions vary significantly regarding valuation. Morningstar initiated coverage with a fair value estimate of $780 billion, less than half the IPO target, citing concerns about overvaluation. Conversely, Polymarket traders indicated an 84% probability that SpaceX would close above $1.8 trillion market capitalization.
The inclusion of SpaceX in the Nasdaq 100 Index is expected within 15 trading days after the IPO, which could drive additional passive investment flows. This technical factor may provide underlying support for the stock price as index-tracking funds build positions.
Practical Trading Recommendations
Traders should establish clear entry and exit points before initiating positions. For those considering long positions, waiting for a pullback toward the $150-$155 range could offer better risk-adjusted entry opportunities. Stop-loss orders should be placed below the IPO price of $135 to protect against significant downside moves.
For short-term trading, monitoring volume patterns and price action around the $175 and $200 resistance levels will be crucial. Breakouts above these levels with strong volume could signal continuation of the uptrend, while rejections may indicate the need for consolidation.
The stock's behavior in the coming trading sessions will establish important reference points for future technical analysis. Given that this is the first trading day, price discovery remains ongoing, and volatility should be expected. Traders should remain flexible and prepared to adjust strategies as more data becomes available and as the stock establishes its trading range.
@Gate_Square