tanwarisb

vip
Age 0.2 Year
Peak Tier 0
No content yet
#MyGateTradeStory
The Velocity Trap: How SOL's $64.70 Pivot Almost Cost Me Everything
The Paradox of Precision
Here is the uncomfortable truth that haunts every trader who has ever nailed an entry: being right at the wrong scale is more dangerous than being wrong. I learned this staring at my screen on a Thursday afternoon, watching Solana hover at $64.70, convinced I had decoded the matrix. What I had actually decoded was my own ego dressed in technical clothing.
The Setup: Reading the $64.70 Tea Leaves
SOL had been dancing around the $64.70 level for days, and the technical picture was spea
SOL-0.35%
HighAmbition
#MyGateTradeStory
The Velocity Trap: How SOL's $64.70 Pivot Almost Cost Me Everything
The Paradox of Precision
Here is the uncomfortable truth that haunts every trader who has ever nailed an entry: being right at the wrong scale is more dangerous than being wrong. I learned this staring at my screen on a Thursday afternoon, watching Solana hover at $64.70, convinced I had decoded the matrix. What I had actually decoded was my own ego dressed in technical clothing.
The Setup: Reading the $64.70 Tea Leaves
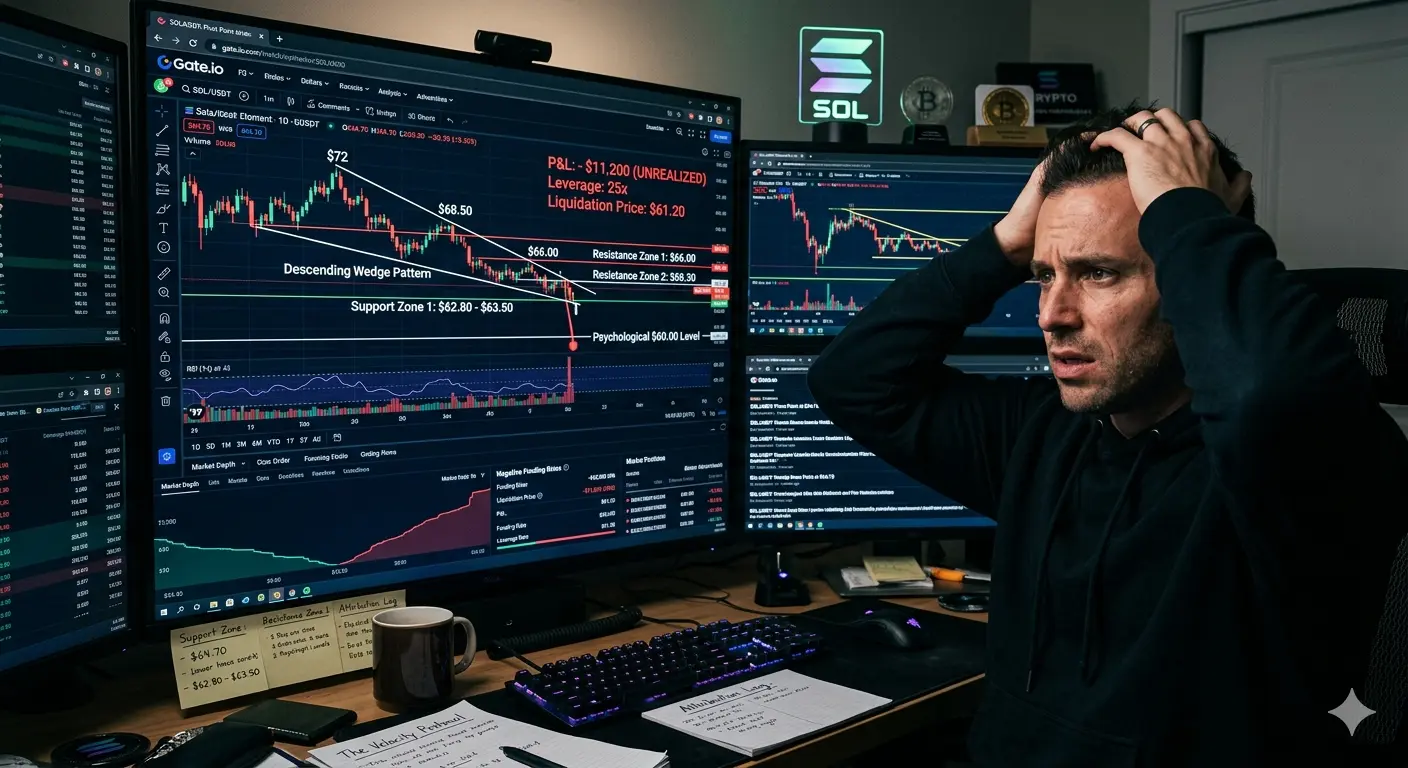
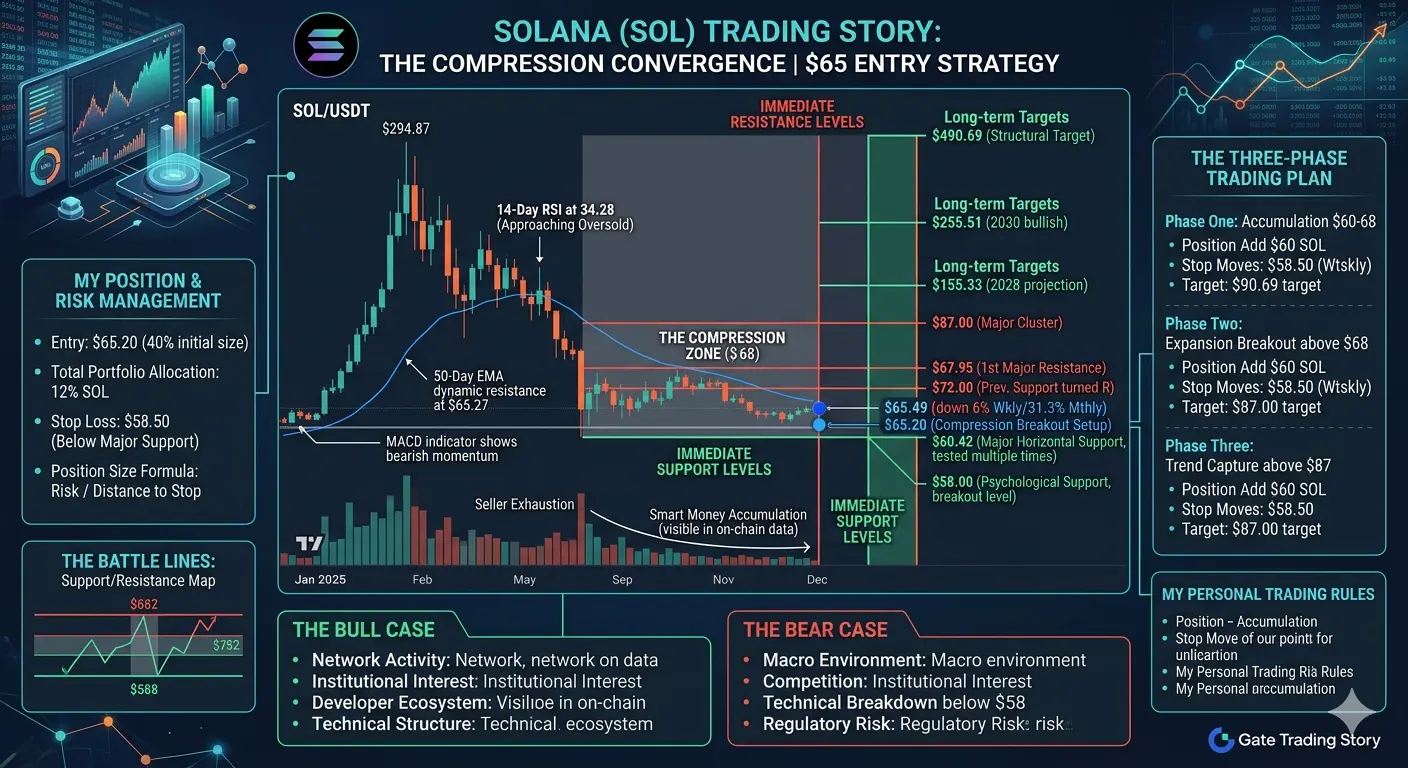
SOL had been dancing around the $64.70 level for days, and the technical picture was speaking clearly if you knew how to listen. The price action had formed a descending wedge pattern from the $72 rejection, with lower highs compressing against a stubborn support floor at $62.80. The 14-day RSI sat at 43, neither oversold nor overbought, but the funding rates on perpetuals told a different story—negative funding meant shorts were paying longs, a classic contrarian signal that smart money was positioning for upside.
My analysis identified three critical levels. Support Zone 1 sat at $62.80 to $63.50, a previous accumulation range that had held through three separate tests. Support Zone 2 was the psychological $60 level, reinforced by the 200-day moving average hovering at $60.40. Resistance Zone 1 waited at $66.00, the recent local high and a liquidity magnet. Resistance Zone 2 loomed at $68.50, where the descending trendline from the $72 peak would create a make-or-break decision point.
The forecast painted two scenarios. In the bullish case, a break above $66.00 with volume would target $68.50, then $70.00, with a stretch potential toward $72.50 if momentum caught. In the bearish case, a loss of $62.80 would accelerate toward $60.00, then $58.50, with a capitulation wick possible at $56.00.
I entered long at $64.70 with a clear plan: half position at market, half on a dip to $63.50 if it came. Stop loss at $62.20, just below Support Zone 1. Take profit targets at $66.00, $68.00, and $70.00, scaling out at each level.
The Trade: When Mathematics Meets Emotion
The entry was surgical. SOL had just bounced from $63.80, volume was climbing, and the 4-hour candle was printing a bullish engulfing pattern. I opened my position—$2,000 at 25x leverage, giving me $50,000 notional exposure. My liquidation sat at $61.20, a comfortable $3.50 buffer below my stop.
Within six hours, SOL punched through $66.00. I closed 30% of my position at $66.20, locking in $1,200 profit. The momentum felt unstoppable. By Friday morning, price had reached $68.40, and I closed another 40% at $68.20, adding $3,500 to my running total. I held the final 30%, trailing stop moved to breakeven, dreaming of $70.00 and beyond.
The trade was working perfectly. My technical analysis had identified the levels correctly. My execution had been disciplined. My risk management had protected my downside. I was proving that skill could triumph over chance.
The Velocity Distortion Effect
This is where I introduce the framework that now governs my every trade: the **Velocity Distortion Effect**. This is the psychological phenomenon where traders who capture high-velocity moves begin to confuse market momentum with personal mastery. The faster the price moves in your favor, the more your brain rewires to believe you caused the movement rather than merely participated in it.
The Velocity Distortion Effect operates on three levels. First, temporal compression: rapid gains feel like condensed expertise, making weeks of preparation feel like minutes of genius. Second, attribution error: successful outcomes are credited to skill while unsuccessful outcomes await their turn to be blamed on bad luck. Third, scale inflation: each successful trade recalibrates your acceptable position size upward, not because edge has improved, but because confidence has.
By Saturday morning, I was deep in the Velocity Distortion. SOL had pulled back to $67.00, and instead of respecting my trailing stop, I saw opportunity. The $70.00 target was still valid, I told myself. The fundamentals hadn't changed. The technical structure remained intact. I added to my position at $67.20, doubling my exposure. I moved my stop to $65.50, giving the trade room to breathe.
I had transformed from a trader executing a plan into a believer defending a thesis.
The Breakdown: When Support Becomes a Trap
Sunday brought the reversal I had refused to see. SOL broke below $66.00 with authority, then sliced through $65.00 like it wasn't there. My new stop at $65.50 triggered, but slippage on the weekend low liquidity filled me at $64.80. The position I had added was now underwater. Instead of accepting the loss, I averaged down at $64.50, convinced $62.80 would hold.
It didn't. SOL continued falling through $64.00, then $63.00, then crashed through Support Zone 1 at $62.80 like it was paper. I watched my unrealized loss balloon from $2,000 to $8,000 to $14,000. I didn't cut it. I couldn't. The Velocity Distortion had convinced me that my original analysis was so correct that even a $10,000 drawdown was just noise.
By the time I finally closed the position at $61.50, my original $5,700 profit had transformed into an $11,200 loss. The trade that should have defined my month had destroyed it.
The Rebuild: Escaping the Velocity Trap
Recovery required more than risk management—it demanded psychological architecture. I developed the **Velocity Protocol**, a systematic approach to neutralizing the Velocity Distortion Effect before it can take root.
The protocol has four pillars. First, the Speed Tax: any trade that reaches 50% of target profit within 24 hours triggers an automatic 50% position reduction, regardless of remaining upside potential. Speed kills because it breeds attachment. Second, the Attribution Log: before entering any trade after a winner, I must write 200 words distinguishing between market conditions I exploited and skills I demonstrated. Third, the Scale Freeze: position size cannot increase for seven days following any trade exceeding 20% returns. Fourth, the Reversal Rehearsal: before adding to any winning position, I must mentally rehearse closing the entire trade at a loss, feeling the emotional impact before committing capital.
These aren't trading rules. They are cognitive antibodies against the biases that winning activates.
The Technical Framework for SOL Traders
For traders watching SOL at current levels, here is the framework I wish I had followed. Support and resistance are not lines—they are zones of probability where order flow concentrates. At $64.70, SOL sits at a decision point. A sustained hold above $65.00 opens a path to $66.50 and potentially $68.00. A breakdown below $63.50 accelerates toward $61.00 and the critical $60.00 psychological level.
The entry strategy is patience. Wait for confirmation. A 4-hour close above $65.20 with volume above the 20-period average suggests bullish continuation. A rejection at $65.00 with bearish divergence on the RSI warns of downside. The forecast favors range-bound action between $62.00 and $68.00 until a catalyst emerges, but the path of least resistance remains tilted downward while SOL trades below the 50-day moving average at $68.50.
**HighAmbition** is not about capturing every move. It is about surviving to capture the moves that matter. The trader who understands this distinction builds wealth. The one who doesn't builds stories.
The Question
When your last trade moved fast in your favor, did you take profits—or did you take credit?
---
Current SOL Technical Summary for Traders:
Entry Zones: $63.50-$64.50 (support test), $65.20+ (breakout confirmation)
Stop Loss: $62.20 (below major support)
Target 1: $66.00 (local resistance)
Target 2: $68.00-$68.50 (trendline resistance)
Target 3: $70.00+ (momentum extension)
Risk Warning: SOL remains below key EMAs. Bearish sentiment dominates. Trade with reduced size until $68.50 is reclaimed.
*#MyGateTradeStory #SOL #SolanaTrading #CryptoTechnicalAnalysis #TradingPsychology*
repost-content-media
  • Reward
  • Comment
  • Repost
  • Share
#TradFiCFDGoldMasters
Understanding TradFi CFD: Your Gateway to Gold Mastery
Traditional Finance, commonly known as TradFi, represents a revolutionary approach to trading conventional financial assets through modern digital platforms. At its core, TradFi encompasses traditional financial instruments including gold, forex, indices, commodities, and stocks. The Contract for Difference (CFD) mechanism allows traders to speculate on price movements without actually owning the underlying physical assets. This innovative trading method has transformed how investors interact with global markets, mak
HighAmbition
#TradFiCFDGoldMasters
Understanding TradFi CFD: Your Gateway to Gold Mastery
Traditional Finance, commonly known as TradFi, represents a revolutionary approach to trading conventional financial assets through modern digital platforms. At its core, TradFi encompasses traditional financial instruments including gold, forex, indices, commodities, and stocks. The Contract for Difference (CFD) mechanism allows traders to speculate on price movements without actually owning the underlying physical assets. This innovative trading method has transformed how investors interact with global markets, making sophisticated financial instruments accessible to a broader audience.
Gate platform stands at the forefront of this financial evolution, offering one of the most comprehensive TradFi CFD trading experiences in the cryptocurrency exchange ecosystem. The platform enables users to trade gold and other traditional assets with the same ease and efficiency they experience when trading digital currencies. What makes Gate particularly exceptional is its commitment to providing professional-grade trading tools while maintaining user-friendly interfaces that cater to both novice and experienced traders.
The fundamental concept behind CFD trading involves entering into a contract where you agree to exchange the difference in price of an asset from when the position is opened to when it is closed. When trading gold CFDs on Gate, you are essentially predicting whether the price of gold will rise or fall against the US dollar. If your prediction proves correct, you profit from the price differential. This mechanism eliminates the need for physical storage, insurance, or security concerns associated with owning actual gold bullion, while still allowing you to benefit from gold price movements.
Gate platform utilizes USDx as its margin currency for TradFi CFD trading, which is pegged one-to-one with USDT. This stablecoin-based approach ensures that your trading capital maintains consistent value while you engage with volatile traditional markets. The platform requires no manual conversion processes or additional custody charges, streamlining the entire trading experience. Your positions remain fully backed by USDT, providing transparency and security throughout your trading journey.
The trading process on Gate begins with accessing the TradFi section through the mobile application. Users must ensure they are running version 8.4.0 or above to access these features. Upon entering the TradFi CFD section, traders agree to the trading protocol and establish their CFD trading account. The transfer button facilitates seamless movement of funds from your main account to your dedicated CFD trading account, ensuring proper capital allocation for your traditional asset ventures.
Once your account is funded, you can select from various popular trading pairs. Gold trading is represented by the XAUUSD pair, which tracks the international gold price movements. Other available instruments include silver (XAGUSD), platinum (XPTUSD), WTI crude oil (XTIUSD), and the NASDAQ 100 index (NAS100). This diverse selection allows traders to build comprehensive portfolios spanning multiple asset classes, all within a single integrated platform.
The actual trading execution involves choosing your market direction, either buying (going long) when you anticipate price appreciation, or selling (going short) when you expect price depreciation. You then specify your trading amount and execute the order. Gate supports market orders, trigger orders, and take-profit/stop-loss configurations, providing flexibility in how you enter and manage positions.
Understanding the mechanics of leverage is crucial for aspiring Gold Masters. Leverage in CFD trading allows you to control a larger position size than your actual capital would typically permit. This amplification effect means that even small price movements in gold can generate significant returns on your investment. However, it is equally important to recognize that leverage magnifies both profits and losses, making risk management an essential component of successful trading.
Gate platform implements cross-margin mode for all TradFi CFD positions, meaning your available margin is shared across all open positions. This approach offers certain advantages in terms of capital efficiency, as winning positions can help offset margin requirements for losing positions. The liquidation trigger occurs when your margin level reaches fifty percent, providing a safety mechanism to protect against catastrophic losses.
The trading hours for TradFi CFDs follow traditional market schedules, with fixed sessions and market closures, unlike cryptocurrency markets that operate twenty-four hours a day, seven days a week. This characteristic requires traders to be mindful of market opening and closing times, as well as weekend gaps that may affect position valuations. During market closure periods, swap fees may apply, representing the cost of holding positions overnight or through market closures.
To become a true Gold Master through Gate TradFi CFD trading, one must develop a comprehensive understanding of the factors influencing gold prices. Gold serves as both a safe-haven asset and an inflation hedge, responding to various macroeconomic indicators including interest rate decisions, inflation data, geopolitical tensions, and currency fluctuations. The relationship between gold and the US dollar is particularly significant, as these assets typically exhibit inverse correlation. When the dollar weakens, gold often strengthens, and vice versa.
Successful gold trading requires technical analysis skills to identify entry and exit points. Chart patterns, support and resistance levels, moving averages, and momentum indicators all play crucial roles in timing market entries. Fundamental analysis complements technical approaches by providing context for price movements based on economic data releases, central bank policies, and global events that drive investor sentiment toward or away from gold.
Risk management separates amateur traders from Gold Masters. Establishing appropriate position sizes relative to your account balance ensures that no single trade can devastate your capital. Setting stop-loss orders at logical technical levels protects against adverse market movements while allowing your trades sufficient breathing room to develop. Take-profit targets should be established based on realistic price projections, securing gains when the market reaches favorable levels.
Gate platform provides the institutional-grade infrastructure necessary for serious gold traders. The platform risk control systems monitor positions continuously, providing real-time margin updates and liquidation warnings. The best bid and ask pricing ensures competitive execution, while the straightforward settlement process automatically converts non-USD assets to USD at position closure.
The journey to becoming a Gold Master involves continuous education and practice. Gate supports this development through its comprehensive trading environment where users can apply strategies, analyze results, and refine their approaches. The platform commitment to innovation means that new features and improvements are regularly introduced, enhancing the trading experience for all users.
Community engagement also plays a vital role in trading success. Gate vibrant ecosystem connects traders from around the world, facilitating knowledge sharing and strategy discussions. Participating in platform events and competitions can accelerate learning while providing opportunities to earn additional rewards and recognition within the trading community.
The psychological aspect of trading cannot be overlooked. Gold Masters develop emotional discipline, avoiding impulsive decisions driven by fear or greed. They maintain detailed trading journals, reviewing both successful and unsuccessful trades to identify patterns and areas for improvement. This systematic approach to self-improvement distinguishes professional traders from casual participants.
In conclusion, TradFi CFD trading on Gate represents a sophisticated yet accessible pathway to gold market participation. By combining the stability and historical significance of gold with modern trading infrastructure, Gate empowers users to pursue Gold Master status through disciplined strategy, continuous learning, and effective risk management. The platform commitment to security, transparency, and user experience makes it an ideal environment for both beginners starting their gold trading journey and experienced traders seeking advanced tools and features. As traditional finance and digital assets continue to converge, Gate position at this intersection provides unique opportunities for traders ready to master the art of gold CFD trading.
@Gate_Square #MyGateTradeStory
repost-content-media
  • Reward
  • Comment
  • Repost
  • Share
Gate Square Certified Creator Incentive Upgrade: High-quality creators join, share a monthly $20,000 creative prize!
📌 Participation Method
On-site creators: Successfully applying for the "Creator Certification Badge" automatically participates.
Newly joined creators: Need to fill out the onboarding form to apply 👉️ https://www.gate.com/questionnaire/7698
🎁 Creator Benefits
1️⃣ Welcome Gift for First Post: New or returning creators who post their first message will receive $50U rewards!
2️⃣ Weekly Posting Award: Complete weekly posting tasks to easily share a $10,000 prize pool!
3️⃣ Monthl
GT1.05%
HighAmbition
Gate Square Certified Creator Incentive Upgrade: High-quality creators join, share a monthly $20,000 creative prize!
📌 Participation Method
On-site creators: Successfully applying for the "Creator Certification Badge" automatically participates.
Newly joined creators: Need to fill out the onboarding form to apply 👉️ https://www.gate.com/questionnaire/7698
🎁 Creator Benefits
1️⃣ Welcome Gift for First Post: New or returning creators who post their first message will receive $50U rewards!
2️⃣ Weekly Posting Award: Complete weekly posting tasks to easily share a $10,000 prize pool!
3️⃣ Monthly Creative Award: More diverse tracks, complete monthly tasks to share a $1,600 GT prize pool!
4️⃣ Exclusive Promotion Tasks: Join the exclusive creator community, enjoy special promotion tasks and holiday gift packs!
Let your high-quality content be seen by more people, and work together to build a high-quality creator community!
Event details: https://www.gate.com/announcements/article/51536
repost-content-media
  • Reward
  • Comment
  • Repost
  • Share
#MarvellSurgesOver11%LeadingChipSectorWithAI
Marvell Technology Stock Surges Over 11 Percent Leading the Chip Sector with AI Innovation
Marvell Technology has emerged as one of the most compelling stories in the semiconductor industry, with its stock experiencing a remarkable surge of over 11 percent that has captured worldwide investor attention. This comprehensive analysis explores every aspect of Marvell's recent performance, its leadership position in the AI chip sector, and what the future holds for this rapidly evolving company.
Current Price Position and Recent Market Performance
Marve
HighAmbition
#MarvellSurgesOver11%LeadingChipSectorWithAI
Marvell Technology Stock Surges Over 11 Percent Leading the Chip Sector with AI Innovation
Marvell Technology has emerged as one of the most compelling stories in the semiconductor industry, with its stock experiencing a remarkable surge of over 11 percent that has captured worldwide investor attention. This comprehensive analysis explores every aspect of Marvell's recent performance, its leadership position in the AI chip sector, and what the future holds for this rapidly evolving company.
Current Price Position and Recent Market Performance
Marvell Technology currently trades at approximately $316 per share, having reached intraday highs of $324.20 in recent trading sessions. The company's market capitalization has expanded to approximately $230 billion, representing a dramatic transformation from its position just months ago. This valuation places Marvell among the most valuable semiconductor companies globally.
The stock has gained approximately 59 percent since late May, with weekly gains exceeding 55 percent following key catalysts that reshaped market sentiment. This performance comes despite broader semiconductor sector volatility that has seen other chip stocks experience significant declines.
Understanding the 11 Percent Surge Detailed Analysis
The recent surge in Marvell's stock price represents the culmination of multiple positive developments. First, Nvidia Chief Executive Officer Jensen Huang's public endorsement at Computex 2024 provided unprecedented validation, calling Marvell "the next trillion-dollar company." This endorsement from the most influential figure in the artificial intelligence chip industry immediately transformed market sentiment.
Second, Marvell's confirmed inclusion in the S&P 500 index, effective June 22, 2024, has created substantial demand from index funds and institutional investors required to hold S&P 500 constituents.
Third, the company reported record financial results with fiscal year 2026 revenue reaching $8.195 billion, representing a 42 percent year-over-year increase. First-quarter fiscal 2027 results showed revenue of $2.42 billion, up 28 percent year-over-year, with the data center business comprising more than three-quarters of total revenue.
Forecast Price Targets and Analyst Expectations
Wall Street analysts have responded by significantly raising price targets. Stifel recently upgraded its price target to $321 from $230, citing stronger-than-expected demand trends in artificial intelligence data center infrastructure. Some bullish analysts have suggested price targets as high as $290 to $350.
The company has provided guidance for fiscal second-quarter 2027 revenue of approximately $2.70 billion and non-GAAP earnings per share of $0.93. Looking further ahead, Marvell has established an ambitious fiscal year 2028 revenue target of $16.5 billion.
Trading Strategy Considerations
For traders considering Marvell positions, short-term momentum traders might focus on continuation strategies while maintaining strict risk management given the stock's elevated volatility. Long-term investors should concentrate on fundamental business drivers rather than short-term price movements. Dollar-cost averaging strategies may be appropriate for building positions gradually given the stock's volatility.
How High Can Marvell Go Price Potential Analysis
Based on current analyst targets and the company's growth trajectory, price levels between $350 and $400 represent achievable near-term targets if the company continues meeting expectations. For Marvell to reach trillion-dollar market capitalization, the stock would need significant appreciation requiring sustained execution over multiple years.
Key Support and Resistance Levels Technical Analysis
Support levels include approximately $260 to $280, with more significant support around $165. Resistance levels are less clearly defined given the breakout to new all-time highs, but psychological resistance may emerge around $350 to $400. Technical indicators suggest strong momentum, though some divergence could signal potential trend reversal risks.
Leading the Chip Sector After the 11 Percent Surge
Following its impressive surge, Marvell has established itself as a leader within the broader semiconductor sector. Unlike traditional chip manufacturers competing directly with Nvidia in graphics processing units, Marvell has carved out a specialized niche as an essential infrastructure partner for hyperscale cloud providers. This positioning has allowed the company to benefit from AI infrastructure spending without directly competing against Nvidia's dominant market position.
Detailed Explanation of AI Leadership in the Chip Sector
Marvell Technology has emerged as a dominant force in the artificial intelligence chip sector through its specialized focus on custom application-specific integrated circuits and data center connectivity solutions. The company's core strategic advantage lies in designing tailor-made chips for major technology companies including Amazon, Microsoft, and Google.
These custom ASIC programs include Amazon's Trainium chips for artificial intelligence training and inference, Microsoft's Maia processors for Azure AI and OpenAI inference workloads, and Google's Axion custom CPU and adjacent AI programs. This partnership model has created an effective duopoly in the hyperscaler custom silicon market, with Marvell and Broadcom collectively enabling more than 80 percent of hyperscaler custom AI silicon deployments.
Marvell's custom silicon revenue grew from essentially zero to $1.5 billion in fiscal year 2026. The company projects this segment will surpass $10 billion by fiscal year 2029, representing exceptional growth that far exceeds the broader semiconductor industry.
Understanding AI Leadership What Leading with AI Means
When we say Marvell is leading the chip sector with AI, we refer to several interconnected dimensions of leadership. First, Marvell leads in custom AI silicon design, creating specialized processors that optimize performance for specific artificial intelligence workloads. These custom chips deliver superior performance per watt and lower total cost of ownership for hyperscale operators.
Second, Marvell leads in data center connectivity and networking solutions that enable AI infrastructure at scale. As AI models grow increasingly complex and data centers scale to thousands of interconnected processors, the challenge of moving data efficiently between compute nodes has become paramount. Marvell's interconnect technologies play an essential role in linking these massive compute clusters.
Third, Marvell leads in silicon photonics technology, representing the next generation of data center connectivity. The company's PAM DSP technology enhances high-speed data transfer and network reliability in hyperscale data centers, creating deep customer relationships and significant switching costs.
The AI Infrastructure Ecosystem and Marvell's Role
Marvell has positioned itself at the critical intersection of AI compute, networking, and data movement. As Jensen Huang noted, AI bottlenecks are shifting from raw compute power to data movement. When computing challenges are distributed throughout entire data centers, connectivity becomes crucial. Marvell's technologies address this critical need, making the company an essential enabler of next-generation AI infrastructure.
The company's collaboration with Nvidia, including a $2 billion investment earlier in 2024, demonstrates the strategic importance of Marvell's technology. This partnership enables customers to seamlessly integrate Marvell's custom AI chips with Nvidia's networking gear and central processors.
Competitive Positioning and Market Dynamics
Marvell competes primarily with Broadcom in the custom ASIC market, with both companies effectively controlling the majority of hyperscaler custom silicon design partnerships. This market requires deep technical expertise, long development cycles, and trusted relationships with hyperscale customers. These barriers protect Marvell's market position and create potential for sustained above-market growth.
Future Plans and Strategic Initiatives
Marvell's future plans center on capitalizing on the expanding AI infrastructure market. The company plans to expand its custom ASIC business by securing additional design wins and deepening existing partnerships. Marvell has already secured more than 50 custom AI design opportunities across more than 10 customers.
The company also plans continued investment in silicon photonics and advanced networking technologies, and expansion into adjacent markets including automotive and enterprise networking.
Risk Factors and Considerations
Despite the compelling growth narrative, investors should remain aware of risk factors. The stock's rapid appreciation has created elevated valuation metrics leaving limited margin for execution errors. Competitive dynamics could intensify as other semiconductor companies seek to capture share in this high-growth segment. Regulatory risks related to export controls could impact the company's ability to serve certain customers or markets.
Conclusion and Investment Outlook
Marvell Technology's surge of over 11 percent reflects a fundamental re-evaluation of its strategic positioning in the AI infrastructure ecosystem. The company's partnerships with Amazon, Microsoft, and Google, combined with technology leadership in networking and interconnect solutions, create a compelling long-term growth story.
While current valuations require careful consideration and execution risk remains elevated, Marvell's role in enabling next-generation AI infrastructure positions it as a key beneficiary of the ongoing AI revolution. The combination of strong fundamentals, strategic positioning, and market leadership suggests Marvell may continue outperforming the broader semiconductor sector as AI adoption accelerates.
@Gate_Square #MyGateTradeStory
repost-content-media
  • Reward
  • Comment
  • Repost
  • Share
#USPPIHits2.5YearHigh
The United States Producer Price Index (PPI) has surged to its highest level in nearly 2.5 years, creating significant uncertainty across global financial markets. Producer inflation is one of the most closely watched economic indicators because it reflects rising costs at the manufacturing level before they reach consumers. When PPI increases sharply, investors begin pricing in tighter monetary policy, higher interest rates, reduced liquidity, and slower economic growth.
For cryptocurrency markets, this macroeconomic shift is particularly important. Bitcoin, Ethereum, S
HighAmbition
#USPPIHits2.5YearHigh
The United States Producer Price Index (PPI) has surged to its highest level in nearly 2.5 years, creating significant uncertainty across global financial markets. Producer inflation is one of the most closely watched economic indicators because it reflects rising costs at the manufacturing level before they reach consumers. When PPI increases sharply, investors begin pricing in tighter monetary policy, higher interest rates, reduced liquidity, and slower economic growth.
For cryptocurrency markets, this macroeconomic shift is particularly important. Bitcoin, Ethereum, Solana, and the broader digital asset ecosystem have become increasingly correlated with liquidity conditions, Federal Reserve policy, Treasury yields, and institutional capital flows. The latest PPI data suggests inflation remains persistent, potentially delaying interest-rate cuts and keeping financial conditions restrictive for longer than expected.
Understanding the Latest PPI Data
The latest US Producer Price Index registered approximately 6.5% year-over-year, marking its strongest reading in around 2.5 years. On a monthly basis, producer prices increased close to 0.8%, while goods inflation accelerated by 2.8%, accounting for nearly 80% of the overall increase.
Energy prices, transportation costs, manufacturing expenses, and supply chain disruptions remain the biggest contributors to rising producer inflation. Historically, elevated PPI eventually feeds into Consumer Price Index (CPI) data, increasing the likelihood that inflation remains above the Federal Reserve's long-term target.
Higher producer inflation means businesses face rising costs, which are often passed on to consumers through higher prices, creating another wave of inflationary pressure.
Federal Reserve Policy and Market Expectations
The Federal Reserve now faces an increasingly difficult balancing act between controlling inflation and supporting economic growth.
Markets previously expected multiple interest-rate cuts during 2026, but the latest inflation data has significantly reduced those expectations. Investors are now pricing in a much higher probability that rates remain elevated for an extended period or even increase further if inflation continues accelerating.
Higher interest rates directly affect:
Consumer borrowing
Corporate financing
Mortgage rates
Treasury yields
Equity valuations
Cryptocurrency liquidity
Every additional 25 basis point (0.25%) increase reduces speculative liquidity and increases the attractiveness of traditional fixed-income investments.
Global Liquidity Conditions
Liquidity remains the single most important driver of cryptocurrency prices.
When central banks tighten monetary policy:
Money supply growth slows
Institutional leverage decreases
Venture capital investment declines
Stablecoin creation slows
Exchange liquidity weakens
Trading activity becomes more volatile
Global crypto market capitalization currently fluctuates around $3.8 trillion to over $4.2 trillion, while total daily trading volume often ranges between $180 billion and $250 billion during active market sessions.
Periods of declining liquidity generally lead to wider bid-ask spreads, thinner order books, and larger price swings.
Bitcoin Market Analysis
Bitcoin continues to dominate the digital asset ecosystem with approximately 58%–62% market dominance.
Average daily spot and derivatives trading volume frequently ranges between:
$45 billion – $80 billion
Bitcoin futures open interest often exceeds:
$35 billion – $45 billion
Large institutional participation means macroeconomic news rapidly affects price action.
Negative funding rates combined with rising open interest frequently indicate aggressive short positioning. If buying pressure suddenly appears, these positions can trigger powerful short squeezes resulting in 5%–10% intraday rallies.
Conversely, declining liquidity alongside rising leverage can create liquidation cascades that accelerate downside moves.
Ethereum Market Structure
Ethereum remains the second-largest cryptocurrency by market capitalization.
Its average daily trading volume typically ranges between:
$20 billion – $40 billion
ETH derivatives contribute another:
$15 billion – $25 billion
Institutional demand continues growing through staking, DeFi, tokenization, and ETF-related interest.
However, elevated Treasury yields reduce demand for risk assets, causing Ethereum to underperform during periods of monetary tightening.
Long-term fundamentals remain supported by ecosystem expansion and continuous network upgrades.
Solana Liquidity Analysis
Solana has become one of the fastest-growing blockchain ecosystems but also one of the most volatile.
Average daily trading volume often ranges between:
$5 billion – $12 billion
During bullish cycles, Solana can outperform Bitcoin by:
15%–30%
During bearish macroeconomic conditions, corrections of:
20%–35%
are not uncommon due to thinner liquidity and speculative positioning.
Developer growth and ecosystem expansion continue supporting long-term adoption despite short-term volatility.
Stablecoin Liquidity
Stablecoins represent available buying power waiting to enter crypto markets.
Combined market capitalization of USDT, USDC, and other stablecoins exceeds:
$250 billion
When stablecoin supply expands:
Exchange liquidity improves
Institutional buying increases
Spot demand strengthens
Market recoveries accelerate
When supply contracts, liquidity tightens and rallies become harder to sustain.
Trading Volume Analysis
Trading volume provides one of the clearest indicators of market conviction.
Current crypto markets regularly process:
$180B–$250B daily total volume
Bitcoin:
$45B–$80B daily volume
Ethereum:
$20B–$40B daily volume
Solana:
$5B–$12B daily volume
Derivatives account for roughly:
55%–65% of total crypto activity
Spot markets represent:
35%–45%
Higher volume during rallies confirms institutional participation, while weak volume often signals unsustainable moves.
Open Interest and Leverage
Open interest has become a critical indicator for predicting volatility.
Bitcoin futures:
$35B–$45B open interest
Ethereum futures:
$18B–$25B
Combined crypto derivatives:
Frequently exceed $100B
Rapid increases in open interest without corresponding spot buying often indicate excessive leverage, increasing liquidation risk.
Funding Rates
Funding rates reveal trader positioning.
Positive funding:
Long traders pay shorts
Bullish sentiment dominates
Negative funding:
Shorts pay longs
Bearish positioning increases
Short squeeze probability rises
Historically, deeply negative funding combined with strong spot buying has preceded significant Bitcoin rallies.
Institutional ETF Flows
Spot ETF activity has become one of the strongest liquidity drivers.
Daily ETF inflows or outflows can exceed:
Hundreds of millions of dollars
Large positive inflows generally strengthen support levels.
Sustained outflows reduce buying pressure and often coincide with corrections.
Institutional participation continues increasing despite short-term macroeconomic uncertainty
Whale Activity
Large holders continue influencing market direction.
Professional traders monitor:
Wallet accumulation
Exchange inflows
Exchange outflows
OTC transactions
Custodian balances
Heavy exchange withdrawals often indicate long-term accumulation.
Large exchange deposits may signal upcoming selling pressure.
Liquidation Analysis
Liquidations amplify volatility.
During major macro events, forced liquidations frequently exceed:
$500 million
$1 billion
Occasionally over $2 billion within 24 hours
Long liquidations accelerate crashes.
Short liquidations fuel explosive rallies.
Monitoring liquidation heatmaps helps identify potential reversal zones.
Dollar Index and Treasury Yields
A stronger US Dollar generally pressures cryptocurrencies.
Higher Treasury yields above:
4%–5%
make government bonds more attractive than speculative assets.
As capital rotates toward fixed income, crypto demand often weakens temporarily.
Risk Management Strategy
Professional investors should monitor:
PPI
CPI
Federal Reserve meetings
Treasury yields
DXY
ETF flows
Open interest
Funding rates
Stablecoin supply
Exchange liquidity
Position sizing and disciplined risk management become essential during inflation-driven volatility.
Avoid excessive leverage and focus on long-term accumulation during periods of panic.
Long-Term Outlook
Although elevated producer inflation creates short-term pressure, crypto markets remain fundamentally driven by adoption and liquidity cycles.
If inflation moderates and the Federal Reserve eventually pivots toward easing, trillions of dollars in sidelined capital could re-enter risk assets.
Bitcoin, Ethereum, and Solana would likely benefit from:
Improved liquidity
Stronger ETF demand
Lower Treasury yields
Increased institutional participation
Renewed retail confidence
Until then, traders should closely monitor macroeconomic data, trading volumes, funding rates, liquidity conditions, and institutional flows, as these metrics often provide earlier signals of market direction than price action alone.@Gate_Square
repost-content-media
  • Reward
  • Comment
  • Repost
  • Share
#USMayCPIHits3YearHigh
The United States Consumer Price Index (CPI) for May 2026 has surged to 4.2% year-over-year, marking the highest inflation level in three years since April 2023. This significant economic development has sent ripples through global financial markets, with particular implications for the cryptocurrency sector. This report provides a detailed examination of the CPI data, its underlying causes, and the multifaceted effects on digital asset prices, liquidity, and trading volumes.
Understanding the CPI Surge
The Consumer Price Index serves as the primary measure of inflation
HighAmbition
#USMayCPIHits3YearHigh
The United States Consumer Price Index (CPI) for May 2026 has surged to 4.2% year-over-year, marking the highest inflation level in three years since April 2023. This significant economic development has sent ripples through global financial markets, with particular implications for the cryptocurrency sector. This report provides a detailed examination of the CPI data, its underlying causes, and the multifaceted effects on digital asset prices, liquidity, and trading volumes.
Understanding the CPI Surge
The Consumer Price Index serves as the primary measure of inflation in the United States, tracking the average change in prices over time that consumers pay for a basket of goods and services. The May 2026 reading of 4.2% represents a substantial increase from April's 3.8% figure and has exceeded the Federal Reserve's 2% target for an extended period. The headline inflation was primarily driven by energy costs, which jumped 3.9% in May following a 3.8% increase in April. The ongoing Middle East conflict has disrupted shipping lanes through the Strait of Hormuz, pushing oil prices above $100 per barrel at peak levels and directly impacting transportation and manufacturing costs.
Core CPI, which excludes volatile food and energy prices, registered at 2.9% year-over-year with a monthly gain of 0.2%, slightly below the expected 0.3%. This divergence between headline and core inflation suggests that while energy-driven price pressures are significant, underlying inflationary pressures remain somewhat contained. Housing costs increased 3.4% over the twelve-month period, while grocery prices rose 2.7%, reflecting the pass-through effects of higher transportation costs.
Federal Reserve Policy Implications
The elevated CPI reading has fundamentally shifted market expectations regarding Federal Reserve monetary policy. According to CME FedWatch data, markets are now pricing in zero rate cuts for 2026, with some analysts at major financial institutions pushing expectations for the first potential rate cut to mid-2027. Furthermore, the probability of a rate hike by year-end has risen above 70%, representing a dramatic shift from earlier expectations of monetary easing.
The Federal Reserve maintains its current target range of 3.50% to 3.75% for the federal funds rate. The hotter-than-expected inflation print reinforces the "higher for longer" narrative that has dominated monetary policy discussions. Fed officials have consistently emphasized their commitment to bringing inflation back to the 2% target, and the May CPI data provides additional justification for maintaining restrictive policy stance. The upcoming June FOMC meeting, scheduled for June 16-17, will provide crucial guidance through the dot plot projections, which will indicate individual committee members' expectations for the future path of interest rates.
Impact on Bitcoin and Major Cryptocurrencies
Bitcoin, the largest cryptocurrency by market capitalization, has experienced significant volatility in response to the CPI announcement. Following the data release, Bitcoin briefly spiked above $62,000 on the softer core CPI reading but subsequently gave back gains as risk sentiment turned cautious. Current trading levels hover around $60,000 to $61,000, representing a decline of approximately 10% over the past week and roughly 24% from recent highs.
The technical outlook for Bitcoin shows critical support levels at approximately $60,270, with downside targets extending to $59,060, $57,444, and potentially a broader risk zone between $50,000 and $38,000 if Bitcoin fails to reclaim the $63,800 resistance level. The firmer dollar and higher Treasury yields resulting from reduced rate-cut expectations have created headwinds for risk assets, including cryptocurrencies.
Ethereum, the second-largest cryptocurrency, has similarly faced pressure, with price action reflecting the broader risk-off sentiment in digital asset markets. The correlation between traditional risk assets and cryptocurrencies has remained elevated, with macroeconomic factors driving price action across the sector.
Altcoin Market Performance
The altcoin sector has experienced even more pronounced volatility compared to Bitcoin. Smaller market capitalization tokens typically exhibit higher beta to Bitcoin's price movements, amplifying both gains and losses. Decentralized finance (DeFi) tokens, layer-1 blockchain assets, and meme coins have all faced selling pressure as liquidity conditions tighten.
Trading volumes across major altcoins have increased significantly during the CPI announcement period, with daily volumes rising by approximately 15% to 25% across major exchanges. This volume spike reflects both panic selling from risk-averse investors and opportunistic buying from traders seeking to capitalize on volatility. However, the net flow has been predominantly negative, indicating capital outflows from the altcoin sector.
Liquidity and Market Depth Analysis
The cryptocurrency market's liquidity conditions have deteriorated following the CPI announcement. Bid-ask spreads have widened across major trading pairs, with Bitcoin spreads increasing by approximately 20% to 30% on major exchanges. Order book depth has decreased, particularly on the buy side, as market makers reduce exposure to manage risk.
Stablecoin flows provide insight into market liquidity conditions. Tether (USDT) and USD Coin (USDC) market capitalizations have shown mixed signals, with some outflows indicating capital leaving the crypto ecosystem entirely rather than rotating within it. Exchange balances of major cryptocurrencies have increased slightly, suggesting that some investors are moving assets to exchanges in preparation for potential selling.
Trading Volume Dynamics
Daily trading volumes across the cryptocurrency market have surged in response to the CPI data. Spot market volumes on major exchanges have increased by approximately 30% to 40% compared to the weekly average. Derivatives markets have seen even more significant activity, with futures open interest fluctuating as traders adjust positions.
Perpetual futures funding rates have turned negative for several major cryptocurrencies, indicating that short sellers are paying long holders and suggesting bearish sentiment dominates derivatives markets. This funding rate dynamic can create reflexive pressure on spot prices as arbitrageurs sell spot and buy futures to capture funding payments.
Correlation with Traditional Markets
The correlation between cryptocurrencies and traditional risk assets has intensified following the CPI announcement. Bitcoin's correlation with the Nasdaq 100 and S&P 500 has risen to approximately 0.6 to 0.7 on a rolling 30-day basis. This increased correlation reduces the diversification benefits of cryptocurrency allocation and subjects digital assets to the same macroeconomic headwinds affecting technology stocks.
Gold and silver, traditional inflation hedges, have paradoxically declined despite the inflationary CPI print, with gold falling approximately 23% from its January 2026 high and silver dropping roughly 44% from its peak. This counterintuitive price action reflects the dominance of real interest rate considerations over inflation concerns, as higher nominal rates increase the opportunity cost of holding non-yielding assets.
Long-Term Implications for Cryptocurrency Adoption
Despite near-term price pressure, the elevated inflation environment may strengthen the long-term investment thesis for Bitcoin and certain cryptocurrencies. Bitcoin's fixed supply of 21 million coins and predetermined issuance schedule stands in stark contrast to fiat currencies subject to central bank expansion. The persistent inflation above the Fed's target highlights ongoing fiat currency debasement risks, potentially reinforcing Bitcoin's narrative as digital gold and a store of value.
Institutional adoption trends may accelerate as institutional investors seek alternatives to traditional inflation hedges that have failed to perform as expected. Corporate treasury allocations to Bitcoin, pioneered by companies such as MicroStrategy, may serve as a template for other firms seeking to protect purchasing power.
Market Outlook and Key Levels
The near-term outlook for cryptocurrency markets remains challenging as markets digest the implications of sustained higher interest rates. The June FOMC meeting represents the next critical catalyst, with the dot plot projections likely to confirm the shift toward a more hawkish policy stance.
For Bitcoin, reclaiming the $63,800 level would signal potential trend reversal and open the path toward $67,000 and $70,000 resistance levels. Failure to hold current support could trigger further downside toward the $57,000 to $59,000 range. Ethereum faces similar technical challenges, with key support at $3,200 and resistance at $3,800.
Conclusion
The US May CPI reading of 4.2% represents a significant inflection point for cryptocurrency markets. The data has fundamentally altered Federal Reserve policy expectations, eliminated prospects for near-term rate cuts, and increased the probability of additional tightening. These developments have created substantial headwinds for risk assets, including cryptocurrencies.
Bitcoin and major altcoins have experienced price declines of 10% to 25% from recent highs, with trading volumes surging as market participants reposition portfolios. Liquidity conditions have deteriorated, and correlations with traditional risk assets have increased, reducing diversification benefits.
However, the elevated inflation environment reinforces the long-term value proposition of scarce digital assets like Bitcoin. As central banks maintain restrictive policy to combat inflation, the contrast between fixed-supply cryptocurrencies and expandable fiat currencies becomes more pronounced. Investors with longer time horizons may view current price weakness as an opportunity to accumulate positions, while traders should remain vigilant regarding volatility and manage risk accordingly.
The cryptocurrency market's evolution continues to reflect its maturation as an asset class increasingly sensitive to macroeconomic developments. Successful navigation of this environment requires understanding the interplay between monetary policy, inflation dynamics, and digital asset valuations. The coming weeks will provide crucial insights into whether current price levels represent a temporary correction or the beginning of a more extended bearish phase.
@Gate_Square #MyGateTradeStory
repost-content-media
  • Reward
  • Comment
  • Repost
  • Share
#BitmineAddsAnother25KEther
BitMine Immersion Technologies (BMNR) has once again demonstrated its aggressive Ethereum accumulation strategy by purchasing an additional 25,000 ETH worth approximately $41 million. This latest acquisition brings the company's three-day buying spree to a staggering 125,000 ETH, valued at roughly $206 million. The purchase was executed through custodian BitGo and represents another significant step toward the company's ambitious goal of acquiring 5% of the total Ethereum supply.
Current Market Data and Purchase Details
The purchase comes at a time when Ethereum is
ETH-0.61%
BTC0.39%
HighAmbition
#BitmineAddsAnother25KEther
BitMine Immersion Technologies (BMNR) has once again demonstrated its aggressive Ethereum accumulation strategy by purchasing an additional 25,000 ETH worth approximately $41 million. This latest acquisition brings the company's three-day buying spree to a staggering 125,000 ETH, valued at roughly $206 million. The purchase was executed through custodian BitGo and represents another significant step toward the company's ambitious goal of acquiring 5% of the total Ethereum supply.
Current Market Data and Purchase Details
The purchase comes at a time when Ethereum is trading at approximately $1,681 per ETH. BitMine has been actively accumulating ETH during this price level, viewing the current market conditions as an opportunity rather than a setback. Chairman Tom Lee has characterized the recent market downturn as superficial, arguing that Ethereum's fundamentals are actually strengthening despite the price softness. The company is funding these acquisitions through a $250 million private placement designed to support both its ETH treasury expansion and Bitcoin mining operations.
BitMine's total ETH holdings have now reached 5.54 million ETH, representing approximately 4.59% of all Ethereum in existence. With a total supply of 120.7 million ETH, BitMine is now just 0.41% away from its stated target of 5%. This means the company owns roughly one out of every twenty ETH tokens ever created. In just eleven months since beginning this strategy, BitMine has achieved 92% of its "Alchemy of 5%" goal.
Impact on Ethereum Market
This massive institutional buying has several significant implications for the Ethereum market. First and foremost, it represents a strong vote of confidence from one of the largest corporate treasuries in the crypto space. When a single entity acquires nearly 5% of an asset's total supply, it creates substantial supply pressure and reduces available liquidity for trading. Approximately 85% of BitMine's ETH holdings are staked through its proprietary Made-in-America Validator Network (MAVAN), which further reduces the circulating supply available for trading.
The staking operation is projected to generate annualized revenues of approximately $230 million, derived entirely from participating in Ethereum's proof-of-stake consensus mechanism. With 4.72 million ETH currently staked, BitMine has become the largest ETH staker in the world. This concentration of staked ETH has implications for network security and decentralization, though BitMine maintains that its MAVAN platform is designed with security, performance, and resilience as core priorities.
From a market sentiment perspective, BitMine's continued accumulation sends a powerful bullish signal to other investors. The company is essentially betting on what Tom Lee calls an upcoming Ethereum "supercycle," driven by two converging trends: the tokenization of real-world assets and artificial intelligence applications built on blockchain infrastructure. Lee believes that as AI systems capabilities improve, the demand for decentralized and hardened solutions will increase, particularly to protect users from agentic systems.
Impact on BitMine Company (BMNR)
For BitMine itself, this strategy represents a fundamental transformation from a Bitcoin mining company to the world's largest Ethereum treasury. The company's total crypto and cash holdings now stand at $9.6 billion, including 5.54 million ETH tokens, $247 million in cash, 204 Bitcoin, and strategic investments in Beast Industries ($180 million) and Eightco Holdings ($88 million). This positions BitMine as the number one Ethereum treasury globally and the second-largest crypto treasury overall, behind only Strategy Inc. (MSTR).
The stock has become one of the most actively traded in the United States, ranking 148th by average daily dollar volume with approximately $829 million in daily trading volume (5-day average). This high liquidity makes BMNR an attractive vehicle for investors seeking exposure to Ethereum without directly holding the cryptocurrency. The stock currently trades at $16.78, and its performance is increasingly correlated with Ethereum's price movements.
However, this strategy also carries significant concentration risk. With nearly 5% of its entire asset base tied to a single cryptocurrency, BitMine's financial health is deeply intertwined with Ethereum's price performance. If the company ever needed to liquidate a meaningful portion of its holdings, the sell pressure could move the market against it. Additionally, the $250 million private placement funding these purchases means shareholders face dilution, betting that ETH appreciation plus staking yields will more than compensate for the equity dilution.
The company has also launched MAVAN as an institutional-grade staking platform, which while originally developed for BitMine's own treasury, is expected to expand to serve institutional investors, custodians, and ecosystem partners. This creates a potential additional revenue stream beyond the core ETH appreciation thesis.
Looking Forward
BitMine expects to reach its "Alchemy of 5%" target sometime in 2026, which would make it one of the most concentrated holders of any major cryptocurrency. The company's strategy represents a new model for corporate treasury management in the crypto age, one that prioritizes accumulation and staking yield over traditional cash holdings.
For investors considering BMNR, the stock offers leveraged exposure to Ethereum's price movements combined with the additional yield from staking operations. However, potential investors should be aware of the concentration risks and the company's dependence on continued favorable market conditions for Ethereum. The high trading volume suggests strong institutional interest, but also implies significant volatility as the stock price responds to both crypto market movements and company-specific developments.
The broader implications for Ethereum are also noteworthy. As more ETH gets locked up in corporate treasuries and staking contracts, the available supply for trading decreases, potentially creating upward price pressure if demand remains constant or increases. BitMine's strategy, if successful, could serve as a template for other institutions looking to gain exposure to digital assets while generating yield through staking.
In conclusion, BitMine's latest 25,000 ETH purchase is more than just another corporate acquisition. It represents a continuation of one of the most aggressive institutional accumulation strategies in crypto history, with implications for Ethereum's supply dynamics, market sentiment, and the evolution of corporate crypto treasury management.
@Gate_Square #MyGateTradeStory
repost-content-media
  • Reward
  • Comment
  • Repost
  • Share
#GateLaunchesHongKongStockTrading
Gate: From a Leading Cryptocurrency Exchange to a Multi-Asset Trading Platform
The financial technology landscape is rapidly evolving, and Gate has positioned itself as a major player in this transformation. Originally launched as a cryptocurrency exchange, Gate has developed into a multi-asset trading platform that aims to bridge digital assets with traditional financial markets. This evolution reflects a broader industry trend where trading platforms are expanding their offerings to meet the growing demand for diversified investment access through a single
HighAmbition
#GateLaunchesHongKongStockTrading
Gate: From a Leading Cryptocurrency Exchange to a Multi-Asset Trading Platform
The financial technology landscape is rapidly evolving, and Gate has positioned itself as a major player in this transformation. Originally launched as a cryptocurrency exchange, Gate has developed into a multi-asset trading platform that aims to bridge digital assets with traditional financial markets. This evolution reflects a broader industry trend where trading platforms are expanding their offerings to meet the growing demand for diversified investment access through a single interface. By integrating multiple asset classes, Gate provides users with a more unified trading experience and simplifies portfolio management in today’s interconnected financial environment.
Point One: Expansion into Traditional Financial Assets
Gate has expanded its ecosystem beyond cryptocurrencies to include access to traditional financial instruments. These may include selected global stocks, ETFs, indices, forex pairs, precious metals, and commodities through derivative-based products such as CFDs, depending on regional availability and regulatory compliance.
Rather than functioning solely as a digital asset exchange, this expansion reflects a structural shift toward broader financial market coverage. Users can potentially explore multiple asset categories within one ecosystem, reducing the need for multiple brokerage accounts.
This development also signals a gradual blending of financial sectors, where crypto-native platforms are increasingly aligning with traditional market infrastructure.
Point Two: Strengthening Platform Capability and Infrastructure
Gate originally built its reputation in the cryptocurrency sector, supporting millions of users globally and offering access to a wide selection of digital assets. Over time, the platform has introduced additional financial tools designed to enhance trading efficiency and system performance.
The multi-asset structure is built around improving user experience through integrated systems such as unified accounts, streamlined funding flows, and advanced trading interfaces.
To support multi-market functionality, platforms like Gate typically rely on high-performance matching engines, liquidity aggregation systems, and risk control frameworks designed to handle varying market conditions across asset classes.
This infrastructure focus plays a critical role in maintaining execution quality, especially during periods of high volatility.
Point Three: One-Platform Trading Experience for Users
One of the key advantages of a multi-asset ecosystem is operational simplicity. Traditionally, investors needed separate accounts for crypto trading, equities, forex, and commodities, often dealing with fragmented systems and funding processes.
With an integrated platform approach, users can manage multiple asset classes from a single interface. This improves portfolio visibility, reduces administrative friction, and enhances overall trading efficiency.
A unified dashboard also allows users to better monitor cross-market exposure, which is increasingly important in a globalized financial environment where crypto and traditional markets often react to similar macroeconomic drivers.
Point Four: Hong Kong as a Strategic Financial Hub
Hong Kong plays an important role in global finance due to its strong regulatory framework, international connectivity, and position as a gateway between Eastern and Western markets.
Gate’s operational focus in this region reflects a broader strategy of aligning with established financial jurisdictions while expanding product capabilities under structured compliance environments.
This positioning can support cross-border financial accessibility while maintaining alignment with evolving regulatory expectations in both digital and traditional asset sectors.
Point Five: Liquidity, Market Access, and Trading Efficiency
A key benefit of multi-asset platforms is improved liquidity distribution across different markets. By aggregating trading activity across asset classes, platforms can potentially enhance order matching efficiency and reduce fragmentation.
For traders, this can translate into tighter spreads, more consistent execution, and better capital utilization.
Additionally, access to multiple asset classes allows users to rotate capital across markets based on changing macroeconomic conditions, improving flexibility in portfolio construction.
Point Six: Institutional Adoption and Market Evolution
The broader financial industry is witnessing increased interest from institutional participants in digital assets and hybrid trading ecosystems.
As infrastructure matures, platforms that support both crypto and traditional financial instruments may become more relevant for institutional strategies that require diversified exposure.
This shift is also encouraging the development of more advanced trading tools, including algorithmic systems, risk analytics, and cross-asset correlation tracking.
Point Seven: Risk Management and Market Stability
Operating across multiple asset classes requires strong risk management frameworks. Market volatility, liquidity shifts, and cross-asset correlation risks must all be managed within a unified system.
Platforms like Gate typically implement layered risk controls, including margin monitoring, liquidation engines, exposure limits, and real-time risk assessment tools.
These systems are essential for maintaining stability, especially when dealing with leveraged products or derivative-based instruments across different financial markets.
Point Eight: Growing Industry Trend of Market Convergence
The integration of cryptocurrency and traditional financial markets is part of a larger global trend in financial innovation. Increasingly, platforms are moving toward unified ecosystems that combine multiple asset classes under one infrastructure layer.
This convergence improves capital efficiency and allows investors to access a broader range of financial instruments without switching between platforms.
Crypto markets contribute innovation and high-growth potential, while traditional markets provide structural depth and long-term capital stability.
Future Outlook: Toward Unified Financial Ecosystems
The future of trading platforms is likely to move further toward integration, where users can manage diversified portfolios across crypto, equities, commodities, and forex from a single environment.
Gate’s evolution reflects this direction, emphasizing accessibility, infrastructure development, and multi-market connectivity.
As global financial systems continue to converge, platforms that successfully integrate multiple asset classes while maintaining security and compliance may play a central role in shaping the next phase of digital finance.
Conclusion: A Unified Approach to Modern Trading
Gate has developed into a multi-asset trading platform that combines access to digital assets and selected traditional financial instruments within a single ecosystem. This approach reflects the ongoing evolution of global financial markets toward integration and accessibility.
By offering a unified interface, advanced trading tools, and broader market access, Gate aims to simplify the trading experience for users who want exposure to multiple asset classes. The platform’s continued development highlights the growing demand for integrated financial solutions that connect crypto and traditional markets.
Overall, Gate represents a step toward more unified financial ecosystems where users can manage diverse investments more efficiently from one platform.@Gate_Square
repost-content-media
  • Reward
  • Comment
  • Repost
  • Share
#预测世界杯美国VS巴拉圭
World Cup 2026 Prediction Analysis: Germany vs Curaçao and Brazil vs Morocco
The FIFA World Cup 2026 has kicked off with incredible excitement across North America, and the prediction markets on Polymarket are showing fascinating insights into the upcoming matches. As we analyze the data-driven probabilities and team performances, here are my detailed predictions for the key matches.
Germany vs Curaçao Match Analysis
Germany enters this Group E encounter as overwhelming favorites according to Polymarket data, with the prediction markets pricing them at an impressive 93.7 cents,
HighAmbition
#预测世界杯美国VS巴拉圭
World Cup 2026 Prediction Analysis: Germany vs Curaçao and Brazil vs Morocco
The FIFA World Cup 2026 has kicked off with incredible excitement across North America, and the prediction markets on Polymarket are showing fascinating insights into the upcoming matches. As we analyze the data-driven probabilities and team performances, here are my detailed predictions for the key matches.
Germany vs Curaçao Match Analysis
Germany enters this Group E encounter as overwhelming favorites according to Polymarket data, with the prediction markets pricing them at an impressive 93.7 cents, which translates to approximately 94 percent implied probability of victory. This is one of the most lopsided matchups of the tournament given the vast difference in experience and quality between these two sides.
The German national team, under the guidance of Julian Nagelsmann, has assembled a squad that combines youthful energy with experienced leadership. Players like Jamal Musiala, Florian Wirtz, and Kai Havertz represent the new generation of German football talent, while the team maintains the tactical discipline that has historically defined German football. After disappointing exits in the 2018 and 2022 World Cups, Die Mannschaft is determined to restore their reputation on the global stage.
Curaçao, making their World Cup debut, faces an enormous challenge. Ranked 82nd in the FIFA rankings, they are one of the lowest-ranked teams in the tournament. While their participation is a historic achievement for the small Caribbean nation, the gulf in class between them and a traditional powerhouse like Germany is substantial. Polymarket has priced Curaçao at just 2.4 cents, reflecting the minimal chance of an upset.
My prediction for this match is a comfortable Germany victory. Based on the prediction market consensus and the teams relative strengths, I anticipate Germany will win by a margin of at least three goals. The spread markets on Polymarket show Germany minus 3.5 goals at 49 cents, suggesting the market expects a dominant performance. Given Germany recent form, including a 6-0 victory over Slovakia in their final preparation match, they should have no trouble dispatching Curaçao.
Brazil vs Morocco Match Analysis
The Brazil versus Morocco clash represents one of the most intriguing matchups of the opening round. According to Polymarket data, Brazil holds a significant advantage with moneyline odds showing them at approximately 61 cents, translating to a 61 percent chance of victory. Morocco is priced at around 16 to 17 cents, with the draw market sitting at roughly 24 percent.
Brazil arrives at this World Cup with immense pressure and expectation. As five-time champions, they have not lifted the trophy since 2002, and their quarterfinal exit in 2022 was considered a disappointment. Under new management, they have assembled a squad featuring world-class talents like Vinícius Júnior, Rodrygo, and an experienced supporting cast. The appointment of Carlo Ancelotti as manager brings Champions League-winning pedigree to the national team setup.
Morocco, however, enters this match with genuine confidence after their historic semifinal run in the 2022 World Cup. They have proven they can compete with the world elite, having defeated Belgium, Spain, and Portugal in Qatar. The Atlas Lions possess a well-organized defensive structure and players like Achraf Hakimi and Sofyan Amrabat who perform at the highest club levels in Europe.
The prediction markets reflect respect for Morocco capabilities, as evidenced by the relatively high probability assigned to the draw outcome. This is not a straightforward match for Brazil by any means. Morocco defensive solidity and counter-attacking threat could trouble the Brazilian backline.
My prediction for this encounter is a narrow Brazil victory. While the markets favor Brazil significantly, I believe Morocco will make this a competitive contest. Brazil superior individual quality in the attacking third should ultimately prove decisive, but expect a tight match with Brazil winning by a single goal margin or potentially a 2-1 scoreline. The both teams to score market on Polymarket suggests there is value in expecting Morocco to find the net against Brazil.
Trading Strategy and Market Insights
For those participating in the Gate World Cup prediction contest, understanding how to interpret these Polymarket probabilities can provide an edge. The Germany match represents a high-confidence prediction given the extreme probability differential. However, the Brazil versus Morocco match offers more nuanced opportunities, as the market has not fully discounted Morocco threat.
When analyzing these prediction markets, it is important to remember that they reflect the collective wisdom of thousands of traders who have real money at stake. The prices incorporate not just team quality but also factors like injuries, tactical matchups, and historical performance data. The Brazil versus Morocco market showing a 24 percent draw probability suggests traders recognize this as a potentially tight contest despite Brazil superior talent.
For the purposes of this prediction contest, I am backing Germany to win decisively against Curaçao and Brazil to secure a hard-fought victory over Morocco. These outcomes align with the Polymarket consensus while accounting for the specific dynamics of each matchup.
The World Cup prediction markets continue to evolve as new information becomes available, and smart participants will monitor these movements closely. Good luck to everyone participating in the Gate World Cup prediction contest, and may the best predictions win.
@Gate_Square
repost-content-media
  • Reward
  • Comment
  • Repost
  • Share
#SpaceXIPOAttractsOver250BillionInOrders
SpaceX IPO: $250 Billion in Orders - A Historic Market Event
SpaceX has achieved a monumental milestone in financial history with its initial public offering attracting over $250 billion in investor orders. This unprecedented demand represents one of the most significant IPO events ever recorded on Wall Street. The following comprehensive analysis explores the key aspects of this groundbreaking development.
Understanding the IPO Phenomenon
An initial public offering represents the first time a private company offers its shares to the public for purchas
HighAmbition
#SpaceXIPOAttractsOver250BillionInOrders
SpaceX IPO: $250 Billion in Orders - A Historic Market Event
SpaceX has achieved a monumental milestone in financial history with its initial public offering attracting over $250 billion in investor orders. This unprecedented demand represents one of the most significant IPO events ever recorded on Wall Street. The following comprehensive analysis explores the key aspects of this groundbreaking development.
Understanding the IPO Phenomenon
An initial public offering represents the first time a private company offers its shares to the public for purchase. When SpaceX decided to go public, it opened the door for individual and institutional investors to own a piece of Elon Musk revolutionary aerospace enterprise. This process transforms a privately held company into a publicly traded entity, subject to regulatory oversight and market dynamics.
The $250 Billion Demand Explained
The $250 billion figure represents total investor demand for SpaceX shares, significantly exceeding the $75 billion the company aimed to raise. This creates an oversubscription rate of approximately three and a half to four times the planned offering size. Such massive oversubscription indicates extraordinary confidence in SpaceX future prospects and reflects the company position as a leader in space technology and satellite communications.
Record-Breaking Valuation Metrics
SpaceX targeted a valuation of approximately $1.77 trillion through this IPO, pricing shares at $135 each. With about 555.6 million shares offered, this would establish SpaceX among the most valuable publicly traded companies globally. The company market capitalization briefly surpassed $2 trillion during its first trading day, with shares surging 19 percent to close at $161.
Starlink: The Revenue Powerhouse
Starlink serves as SpaceX primary revenue generator and growth engine. In 2025, SpaceX reported consolidated revenue of $18 billion, with Starlink contributing substantially to this figure. The satellite internet division has emerged as the leader among space-based internet providers since launching its first satellite batch in 2019. Starlink consistent profitability contrasts with other SpaceX segments, making it the cornerstone of investor confidence.
Elon Musk Vision and Leadership
Elon Musk founding of SpaceX in 2002 established the foundation for this historic IPO. His vision of making humanity a multi-planetary civilization drives the company ambitious projects. The successful IPO could potentially make Musk the world first trillionaire, cementing his status as one of history most influential entrepreneurs. Musk statement about wanting people to wake up thinking the future will be great captures the essence of SpaceX mission.
Investor Composition and Geographic Interest
The $250 billion demand comes from diverse investor categories. Retail investors alone placed orders exceeding $100 billion, demonstrating widespread public interest. Major institutional players including BlackRock committed at least $5 billion. Additionally, Middle Eastern sovereign wealth funds contributed billions, reflecting global confidence in SpaceX trajectory.
The Oversubscription Challenge
When demand significantly exceeds supply in an IPO, allocation becomes challenging. SpaceX indicated retail investors would receive at least 20 percent of available shares, meaning the majority of individual investor demand would remain unfulfilled. This scarcity dynamic often drives post-IPO price appreciation as unsatisfied demand seeks shares in the secondary market.
Future Revenue Projections
SpaceX regulatory filings project potential future revenue opportunities totaling $28.5 trillion. This includes $26.5 trillion from artificial intelligence initiatives, $1.6 trillion from Starlink broadband services, $740 billion from Starlink mobile connectivity, and $370 billion from space-enabled solutions. While these projections represent long-term potential rather than guaranteed outcomes, they illustrate the vast addressable markets SpaceX targets.
AI Integration and xAI Acquisition
SpaceX recent acquisition of xAI, Elon Musk artificial intelligence startup, along with the X social media platform, creates synergies between three major Musk enterprises. The company AI segment recorded a $6.35 billion operating loss in 2025, reflecting substantial investments in this strategic area. SpaceX envisions building orbital data centers and becoming a significant player in the artificial intelligence race.
Market Impact and Industry Implications
The SpaceX IPO triggered significant market movements, with hedge funds reportedly selling positions in established technology giants to free capital for this historic offering. This rotation demonstrates how transformative IPOs can reshape investment portfolios and market dynamics. The successful debut validates investor appetite for innovative companies addressing frontier technologies.
Risk Factors and Considerations
Despite overwhelming demand, SpaceX faces challenges including net losses of $4.9 billion in 2025 and substantial AI segment investments. The company must demonstrate sustained revenue growth and path to profitability to maintain its valuation. Regulatory scrutiny, competitive pressures from other space companies, and technological execution risks represent ongoing concerns for investors.
Trading Debut Performance
SpaceX shares debuted on the Nasdaq under ticker symbol SPCX on June 12, 2026. The stock opened strong and maintained momentum throughout the first trading session. This performance validated the massive pre-IPO demand and established SpaceX as a major market participant from day one.
Long-Term Investment Thesis
Investors attracted to SpaceX cite multiple long-term growth drivers including expanding Starlink subscriber base, government and military contracts through Starshield, space tourism development, Mars colonization efforts, and artificial intelligence integration. The company vertically integrated approach from rocket manufacturing to satellite deployment to consumer services creates competitive advantages.
Conclusion
The SpaceX IPO represents more than a financial transaction; it marks a watershed moment for the commercial space industry and public market investing. The $250 billion demand figure signals unprecedented confidence in space technology commercialization and Elon Musk execution capabilities. As SpaceX begins its journey as a public company, investors worldwide will closely watch whether this historic debut translates into sustained long-term value creation.
@Gate_Square
repost-content-media
  • Reward
  • Comment
  • Repost
  • Share
#MyGateTradeStory
The Victory Tax: How One Trade Can Steal Your Future
The Paradox of Success
Here is the uncomfortable truth no one tells you: winning can be more dangerous than losing. Most traders obsess over avoiding losses, but the real killer hides inside your victories. I learned this the hard way with a single ESPORTS trade that changed everything.
The Trade That Changed Everything
Three days ago, ESPORTS was on fire. The token had touched $0.33 just days before, a massive 312% pump from its lows. When I saw it retrace to $0.08, my instincts screamed opportunity. I deployed $28 into s
ESPORTS-57.76%
HighAmbition
#MyGateTradeStory
The Victory Tax: How One Trade Can Steal Your Future
The Paradox of Success
Here is the uncomfortable truth no one tells you: winning can be more dangerous than losing. Most traders obsess over avoiding losses, but the real killer hides inside your victories. I learned this the hard way with a single ESPORTS trade that changed everything.
The Trade That Changed Everything
Three days ago, ESPORTS was on fire. The token had touched $0.33 just days before, a massive 312% pump from its lows. When I saw it retrace to $0.08, my instincts screamed opportunity. I deployed $28 into spot trading on Gate, watching the chart with HighAmbition driving my focus.
The price moved. $0.08 became $0.10, then $0.15. I held. It climbed to $0.20, then $0.25. My position was now worth $87.50, a 212% gain in under 48 hours. The euphoria was intoxicating. I had identified the bottom perfectly. My analysis was flawless. I was invincible.
The Psychological Shift
Something shifted in my mind that weekend. That $87.50 did not feel like profit. It felt like my new baseline. My brain had already spent the money on future trades, on the lifestyle this skill would bring, on the trader identity I had earned. The $28 I risked became irrelevant. The $87.50 became my new zero.
This is what I now call the Victory Tax. It is the invisible cost your mind extracts from every win. The tax compounds silently. First, it inflates your risk tolerance. Then it distorts your perception of edge. Finally, it demands payment through overconfidence.
The Behavioral Distortion
Behavioral economists call this the House Money Effect. When we win, we treat the profits as belonging to the house, not to us. We take risks we would never take with our original capital. But the Victory Tax goes deeper. It creates a Success Debt, an obligation your psychology feels to replicate that win, to prove it was not luck, to justify the identity you have claimed.
I stopped analyzing. I started anticipating. Every chart looked like the next ESPORTS. Every dip felt like a gift. My HighAmbition transformed from careful focus into desperate hunger. I needed another win to validate the first one.
The Breakdown
Three days after my triumph, ESPORTS collapsed from $0.33 to $0.07. A 78% crash. I watched it happen in real time, paralyzed by disbelief. The token that made me feel like a genius now mocked me. But here is the critical part: my strategy was not wrong. The setup was valid. The execution was sound. My mindset destroyed me.
I had moved my stop loss three times, certain the dip was temporary. I added to my position at $0.20, then $0.15, averaging down into oblivion. By the time I sold at $0.026, my $87.50 had become $9.10. I did not just give back my profits. I lost my original capital plus the opportunity cost of holding through the carnage.
The Framework
The Victory Tax Framework has three components. First, the Expectation Anchor: your brain locks onto peak profit as your new normal. Second, the Identity Inflation: winning makes you believe you are smarter than the market. Third, the Revenge Cycle: losses feel like personal attacks requiring immediate redemption.
To counter this, I now implement a Profit Amnesia Protocol. After any trade exceeding 100% return, I force a 24-hour cooling period. I write down exactly why the trade worked, what conditions were present, and what percentage was skill versus luck. I treat the profit as already spent on risk management, not as ammunition for the next battle.
The Rebuild
Spot trading on Gate remains my preferred method. The platform provides the tools, but the trader provides the discipline. I rebuilt my system around position sizing rules that ignore my emotional state. I now enter every trade assuming I will lose 100% of the capital deployed. If I cannot accept that outcome calmly, I do not take the trade.
ESPORTS taught me that volatility is not the enemy. Unchecked psychology is. The token moved exactly as markets do. My reaction to the movement was the failure point.
The Reflection
The most expensive lessons in trading do not come from blown accounts or liquidated positions. They come from wins that convince you the game is easier than it is. The Victory Tax is progressive. The more you win without awareness, the higher your rate of self-destruction.
I am grateful for that ESPORTS trade. The $28 I risked bought me a framework worth infinitely more. But I paid the tax in full before I understood the invoice.
What is the biggest win that secretly cost you more than you realized? Share your Victory Tax story below.
@Gate_Square
repost-content-media
  • Reward
  • Comment
  • Repost
  • Share
#MyGateTradeStory
The Velocity Trap: When Speed Becomes Your Enemy
The Paradox of Motion
Here is the uncomfortable truth that destroys more traders than any bear market: the faster you move, the more blind you become. In trading, velocity is not your friend. It is a trap disguised as opportunity. I discovered this framework through a Bitcoin trade that started as precision and ended as chaos.
The Setup: Where Bitcoin Stands Today
Bitcoin is currently trading around $80,914, having tested a 24-hour high of $82,798 and low of $80,686. The market is at a critical juncture. After breaking above b
BTC0.37%
HighAmbition
#MyGateTradeStory
The Velocity Trap: When Speed Becomes Your Enemy
The Paradox of Motion
Here is the uncomfortable truth that destroys more traders than any bear market: the faster you move, the more blind you become. In trading, velocity is not your friend. It is a trap disguised as opportunity. I discovered this framework through a Bitcoin trade that started as precision and ended as chaos.
The Setup: Where Bitcoin Stands Today
Bitcoin is currently trading around $80,914, having tested a 24-hour high of $82,798 and low of $80,686. The market is at a critical juncture. After breaking above bearish pennant resistance near $64,000, BTC now faces a decisive test. The key TBO Support/Resistance level sits just under $64,000, which means the current bounce remains in the category of a reaction rather than a confirmed reversal.
Technical indicators paint a mixed picture. Short-term bullish divergence signals have appeared on hourly charts, but the macro trend remains bearish while TBO and OBV continue to favor sellers. Support levels are established at $60,800 and $66,000, with the broader range extending from $73,875 to $110,902 for September projections. This is not a market for guesswork. It is a market for patience.
The Trade That Revealed the Trap
I entered Bitcoin at $75,699, Strategy's average purchase price, believing that institutional accumulation created a floor. My thesis was simple: if Michael Saylor is buying, the downside is limited. I deployed $2,000 with 3x leverage on Gate futures, targeting a move to $82,000. My position size was $6,000 in exposure.
The trade moved in my favor immediately. Within 48 hours, Bitcoin climbed to $80,914. My unrealized profit hit $1,043, a 52% return on my capital. The chart looked beautiful. The momentum felt unstoppable. I had caught the wave with HighAmbition and precision.
The Psychological Acceleration
Then something invisible happened. My brain began accelerating. The $1,043 profit did not feel like achievement. It felt like lag. I started checking prices every three minutes. I moved my take profit higher, from $82,000 to $85,000, then to $90,000. I convinced myself that breaking $82,798 meant $100,000 was inevitable.
This is the Velocity Trap. It is a psychological framework where winning trades create artificial urgency. Your mind begins operating on compressed timeframes. Decisions that once took hours now take seconds. Risk calculations that required spreadsheets become gut feelings. The market has not changed. Your perception of time has.
Behavioral finance calls this Temporal Compression Bias. When we experience success, our brains release dopamine that literally alters time perception. Minutes feel like hours of opportunity cost. The $1,043 profit became $2,000 in my mind before it existed. I was trading tomorrow's gains today.
The Behavioral Distortion
The Velocity Trap operates through three mechanisms. First, the Acceleration Effect: each tick in your favor increases your emotional investment exponentially. Second, the Horizon Shift: your time horizon collapses from weeks to hours to minutes. Third, the Entitlement Loop: you begin believing the market owes you the next move.
I stopped sleeping. I kept my phone under my pillow. At 3 AM, Bitcoin dipped to $79,500. I added to my position, certain the dip was temporary. My leverage increased from 3x to 5x. My exposure grew to $10,000. I was no longer trading the chart. I was trading my own anxiety.
The Breakdown
Bitcoin did not crash. It simply stopped moving. For three days, price chopped between $80,000 and $81,500. In a normal state, this would be neutral. In my accelerated state, this was torture. Every hour of sideways action felt like theft. I had mentally spent profits that never materialized, and now the market was refusing to pay my imagination.
The breakdown came not from price action but from my reaction to it. I moved my stop loss to breakeven, then below it, then removed it entirely. I told myself I was giving the trade room to breathe. I was actually giving my ego room to destroy me. When Bitcoin finally dipped to $77,000, I was holding a $3,000 loss with no exit plan. The Velocity Trap had consumed my discipline faster than any market crash could.
The Framework
The Velocity Trap Framework requires three countermeasures. First, the Speed Limit Rule: after any trade exceeding 30% unrealized profit, you must enforce a mandatory 12-hour decision freeze. No modifications to position, stops, or targets. Second, the Time Anchor Protocol: write your original thesis timestamp and do not allow your brain to compress it. Third, the Velocity Decay Check: if you find yourself checking prices more than once per hour, you are already trapped.
I rebuilt my system around slowness. Now when I enter a trade, I set my phone to airplane mode for the first four hours. I write my exit plan before my entry. I treat every winning trade as a warning, not a celebration.
The Current Bitcoin Outlook
For traders considering BTC today, the setup remains valid but requires patience. Support at $60,800 offers a logical entry for spot accumulation. Resistance at $82,798 needs to be reclaimed with volume for continuation. The TBO framework suggests caution until we see a clean close above $64,000 on daily timeframes. Strategy holds 843,706 BTC at $75,699 average, sitting $11.7 billion underwater. This is institutional conviction, not retail euphoria.
Futures traders should respect the range. The market is digesting ETF flows, Fed policy uncertainty, and institutional accumulation. This is a market for HighAmbition tempered with discipline, not desperation.
The Reflection
The Velocity Trap taught me that markets do not kill traders. Compressed time perception does. Every major loss in my career came not from bad analysis but from accelerated decision-making after early success. The faster you try to capitalize on an edge, the faster you destroy it.
Bitcoin at $80,914 is not a signal to rush. It is a signal to observe. The traders who survive this cycle will not be the fastest. They will be the ones who refused to let winning trades speed up their minds.
What is the fastest decision you have ever made after a winning trade, and how much did it cost you?
@Gate_Square
repost-content-media
  • Reward
  • Comment
  • Repost
  • Share
#MyGateTradeStory
My Gate Trading Story: The Solana Convergence
The Paradox of Patience
The hardest lesson I learned in crypto trading is that the best opportunities often look like nothing is happening. This is the story of how I turned a $65 Solana entry into a strategic position that taught me more about market structure than any winning trade ever could.
Current Market Reality: SOL at the Crossroads
Solana currently trades at approximately $65.49, down 6% over the past week and 31.3% from its 30-day performance. The token has retraced significantly from its all-time high of $294.87 set in
SOL-0.27%
HighAmbition
#MyGateTradeStory
My Gate Trading Story: The Solana Convergence
The Paradox of Patience
The hardest lesson I learned in crypto trading is that the best opportunities often look like nothing is happening. This is the story of how I turned a $65 Solana entry into a strategic position that taught me more about market structure than any winning trade ever could.
Current Market Reality: SOL at the Crossroads
Solana currently trades at approximately $65.49, down 6% over the past week and 31.3% from its 30-day performance. The token has retraced significantly from its all-time high of $294.87 set in January 2025, presenting what I believe is a generational accumulation opportunity for patient traders.
The technical landscape reveals a fascinating convergence zone. SOL has established critical support at $60.42, a level that has been tested multiple times and held firm. On the upside, immediate resistance sits at $67.95, with the 50-day EMA currently positioned at $65.27 acting as dynamic resistance. The MACD indicator shows bearish momentum, but the 14-day RSI at 34.28 suggests we are approaching oversold territory.
My Entry Story: Reading the Structure
I entered my SOL position at $65.20 after observing a classic accumulation pattern on the daily timeframe. The setup was not glamorous. Price had been ranging between $60 and $68 for three weeks, creating a compression zone that typically precedes significant directional moves. Volume had dried up, indicating seller exhaustion. The market felt dead, which is exactly when smart money begins positioning.
My initial allocation was 12% of portfolio, sized according to my risk management framework. I set my stop loss at $58.50, below the major support cluster, giving the trade room to breathe while protecting capital. My target zones were established at three levels: $87 (first resistance cluster), $103 (2026 forecast high), and $155 (long-term structural target).
The Framework: The Compression Edge
I developed what I call the Compression Edge framework for trades like this. When price consolidates in a tight range after a significant downtrend, three forces converge: seller exhaustion, buyer accumulation, and volatility compression. The longer the compression lasts, the more explosive the eventual breakout. This is not about predicting direction. It is about positioning for either outcome with asymmetric risk-reward.
The Compression Edge requires three confirmations before entry: support holding through multiple tests, volume declining during consolidation, and a clear invalidation level that makes mathematical sense. SOL checked all three boxes at $65.
Support and Resistance: The Battle Lines
Understanding key levels is essential for SOL trading. Here is my complete map:
Immediate Support Levels:
- $60.42: Major horizontal support, tested multiple times
- $58.00: Psychological round number, previous breakout level
- $50.00: Critical long-term support, capitulation zone
Immediate Resistance Levels:
- $67.95: First major resistance, recent rejection point
- $72.00: Previous support turned resistance
- $87.00: Major cluster, 2026 price target zone
Long-term Targets:
- $103.32: End of 2026 forecast (CoinCodex analysis)
- $155.33: 2028 projection
- $255.51: 2030 bullish scenario
- $490.69: Long-term structural target
The Psychology of Position Building
My initial entry was just the beginning. I implemented a scale-in strategy rather than full deployment. At $65.20, I committed 40% of intended position size. If SOL drops to $62, I add another 30%. If we see $58, I complete the position. If price rallies above $68 with volume, I add to winners. This approach removes the pressure of perfect timing.
The emotional journey of this trade tested my discipline. After entry, SOL dipped to $63. My unrealized PnL showed red. The Twitter timeline was filled with bearish predictions. Every instinct screamed to cut losses. But my plan was clear, my levels were valid, and my risk was defined. I held.
This is where most traders fail. They confuse short-term price action with setup invalidation. My stop was at $58.50, not $63. The trade was still alive.
Trading Strategy: The Three-Phase Plan
Phase One: Accumulation (Current)
Entry range: $60-68
Position size: 12% of portfolio
Stop loss: $58.50
Target: $87 (33% gain)
Phase Two: Expansion (Upon breakout above $68)
Add 50% to position
Move stop to breakeven
Target: $103 (58% total gain)
Phase Three: Trend Capture (Above $87)
Trail stops using 20-day EMA
Let winners run toward $155
Take partial profits at each major resistance
Risk Management: The Foundation
No strategy works without proper risk controls. My rules for this SOL trade are non-negotiable:
Maximum portfolio allocation: 15%
Maximum loss per trade: 2% of total equity
Position sizing formula: Risk amount divided by distance to stop
No averaging down below initial stop level
Profit-taking: 30% at first target, 50% at second target, 20% runner
The Gate Advantage
Trading SOL on Gate provides several structural advantages. The platform offers deep liquidity for SOL/USDT and SOL/USD pairs, ensuring minimal slippage on entries and exits. Advanced order types allow precise stop placement and scaled take-profit orders. The futures market provides hedging capabilities for spot positions.
I particularly value the ability to set multiple take-profit levels that execute automatically. This removes emotion from profit-taking decisions and ensures disciplined execution of the strategy.
Market Outlook: The Bull Case
Several fundamental factors support the bullish thesis for SOL:
Network Activity: Solana continues processing more transactions than any other blockchain, with actual usage metrics outperforming competitors.
Institutional Interest: Despite recent ETF rejections, institutional demand for Solana exposure remains strong. Any regulatory clarity could trigger significant capital inflows.
Developer Ecosystem: The number of active developers on Solana has grown consistently, indicating long-term platform viability.
Technical Structure: The 72% drawdown from highs has washed out weak hands. Smart money accumulation is visible in on-chain data.
The Bear Case: What Could Go Wrong
Every trade needs honest risk assessment:
Macro Environment: Continued Fed hawkishness could pressure all risk assets including SOL.
Competition: Ethereum L2 solutions are capturing market share that Solana once dominated.
Technical Breakdown: A close below $58 would invalidate the accumulation thesis and trigger stop losses.
Regulatory Risk: SEC classification remains uncertain for SOL.
My Personal Trading Rules
This SOL trade follows my personal framework that has evolved through years of wins and losses:
Never risk more than you can afford to lose completely
Always define entry, exit, and invalidation before clicking buy
Trade the plan, not the prediction
Let winners run, cut losers fast
Keep a trading journal for every position
The Question That Matters
After months of preparation, analysis, and patient waiting, my SOL position is finally positioned for what I believe will be a significant move. The compression will resolve. The direction will reveal itself. The only question is whether I will have the discipline to execute my plan when the moment arrives.
Here is what I want to ask every trader reading this: When you look at your current positions, do you know exactly where you are wrong, or are you just hoping to be right?
The difference between hoping and knowing is what separates traders who survive from those who thrive.
My SOL trade is not about being bullish or bearish. It is about having a plan that works in either direction. That is my Gate Trading Story.
@Gate_Square
repost-content-media
  • Reward
  • Comment
  • Repost
  • Share
#广场预测世界杯赢40000U
The 2026 FIFA World Cup has officially kicked off, and the excitement is reaching fever pitch across the globe. This historic tournament, being hosted across three nations for the first time ever, brings together the finest football talent from every corner of the world. Gate, one of the leading cryptocurrency exchanges, has recognized this momentous occasion by launching an incredible prediction campaign that allows football enthusiasts and crypto traders alike to participate in the World Cup fever while earning substantial rewards. The Gate World Cup Prediction Campaign is n
HighAmbition
#广场预测世界杯赢40000U
The 2026 FIFA World Cup has officially kicked off, and the excitement is reaching fever pitch across the globe. This historic tournament, being hosted across three nations for the first time ever, brings together the finest football talent from every corner of the world. Gate, one of the leading cryptocurrency exchanges, has recognized this momentous occasion by launching an incredible prediction campaign that allows football enthusiasts and crypto traders alike to participate in the World Cup fever while earning substantial rewards. The Gate World Cup Prediction Campaign is not merely a promotional activity; it represents a bridge between the passionate world of football and the innovative realm of blockchain technology.
The campaign runs from June 9, 2026, through July 21, 2026, covering the entire duration of the World Cup tournament. Participants have the opportunity to compete for a massive prize pool of forty thousand dollars, which includes various rewards such as limited edition World Cup jerseys, prediction market experience vouchers, position vouchers, and direct monetary prizes. This comprehensive reward structure ensures that participants at every level have something valuable to gain from their involvement.
Participation in the Gate World Cup Prediction Campaign is straightforward and accessible to all users. There are two primary methods through which participants can join the campaign. The first method involves publishing World Cup related content using the specific hashtag PredictWorldCupWin40000U. This hashtag serves as the identifier that allows the Gate platform to track and evaluate entries. The second method involves sharing the official Gate World Cup campaign page on Gate Square and posting personal opinions or match analysis alongside the share. Both methods are designed to encourage active engagement and meaningful contributions to the football discussion community.
The content ideas suggested by Gate provide excellent guidance for participants looking to maximize their chances of winning. Match predictions form the core of the campaign, where participants can predict match results, scores, and advancing teams while explaining their reasoning. This approach encourages analytical thinking and research, as successful predictions require understanding team form, player conditions, tactical approaches, and historical head to head records. Another popular content category involves sharing prediction tickets, where participants post screenshots of their World Cup prediction trades or trade links and explain their strategies. This creates a learning environment where community members can observe different trading approaches and risk management techniques.
Daily match analysis represents another valuable content category, where participants analyze upcoming matches based on comprehensive factors including team form, head to head records, injury updates, and performance data. This type of content demonstrates deep knowledge of the sport and provides genuine value to other community members. Dark horse and upset predictions add an element of excitement, as participants identify teams that might surprise the tournament and explain the factors that could lead to unexpected results. Champion predictions allow participants to showcase their long term strategic thinking by predicting the World Cup winner and supporting their choice with detailed reasoning. The football expert challenge category welcomes participants to share unique insights about teams, players, and matches, fostering rich discussions among fellow fans and traders.
The reward structure of the Gate World Cup Prediction Campaign is designed to recognize different types of contributions. The Daily Prediction Champion reward selects ten users each day who have made the most accurate predictions or provided the highest quality analysis. These winners receive fifty dollar position vouchers, which can be used to experience futures trading on the platform. The Lucky Share Reward selects fifty users weekly who successfully share the official Gate World Cup campaign page to Gate Square, with winners receiving twenty dollar position vouchers. Posts that demonstrate creativity and generate higher views and engagement have better chances of winning this category.
The Prediction Leaderboard Rewards represent the most substantial prizes in the campaign. The weekly leaderboard ranks participants based on weekly cumulative views of posts published with the campaign hashtag. The top ranked participant receives a limited edition Gate World Cup jersey plus a five hundred dollar position voucher. The second and third ranked participants receive ten dollar prediction market experience vouchers plus three hundred dollar position vouchers. Ranks four through ten receive five dollar prediction market experience vouchers plus one hundred dollar position vouchers. Ranks eleven through thirty receive fifty dollar position vouchers.
The overall leaderboard offers even more impressive rewards, ranking participants based on total cumulative views throughout the entire campaign. The top three participants receive fifty dollar prediction market experience vouchers, one thousand dollar position vouchers, and limited edition World Cup gift boxes. Ranks four through ten receive twenty dollar prediction market experience vouchers, five hundred dollar position vouchers, and Gate Red Bull backpacks. Ranks eleven through thirty receive five hundred dollar position vouchers, while ranks thirty one through one hundred receive two hundred dollar position vouchers.
Turning our attention to today's matches, June 14, 2026, brings two exciting fixtures in Group E. The first match features Germany versus Curacao at NRG Stadium in Houston, with kickoff at 12:00 PM Central Daylight Time. This match represents a historic occasion for Curacao, as it marks their first ever appearance in the FIFA World Cup. The small Caribbean nation has overcome significant odds to qualify for this tournament, and their participation alone is a remarkable achievement for football in the region.
Germany enters this match as overwhelming favorites, and for good reason. The German squad, known as Die Mannschaft, boasts an impressive array of star players who compete at the highest levels of European football. Joshua Kimmich provides leadership and tactical intelligence in midfield, while Jonathan Tah anchors the defense with his physical presence and reading of the game. In attack, the combination of Leroy Sane, Jamal Musiala, and Florian Wirtz offers creativity, pace, and clinical finishing that few teams in the world can match. Germany's qualifying campaign was dominant, including a resounding six to zero victory over Slovakia that demonstrated their offensive capabilities.
Curacao, despite being massive underdogs, should not be completely discounted. The team has shown resilience throughout their qualification journey and will be highly motivated to make a strong impression on the world stage. The Bacuna brothers are expected to feature prominently in the lineup, bringing experience and technical ability. However, the gulf in quality between the two sides is substantial, and Curacao will need to produce a defensive masterclass while hoping for moments of individual brilliance to trouble the German defense.
My prediction for this match is a comfortable German victory with a scoreline of four to zero. Germany's attacking firepower, combined with Curacao's relative inexperience at this level, suggests that the European giants will control proceedings from the opening whistle. The German team will be eager to make a statement in their opening match and build momentum for the tougher challenges ahead in the tournament.
The second match of the day features Ivory Coast versus Ecuador at Lincoln Financial Field in Philadelphia, kicking off at 7:00 PM Eastern Time. This fixture represents one of the most intriguing matchups of the opening round, as both teams possess quality players and realistic ambitions of advancing from Group E. The contrast in styles between these two teams makes for a fascinating tactical battle.
Ivory Coast brings a squad filled with attacking talent and physical presence. The Elephants have traditionally been known for their powerful, direct style of play, and this generation continues that tradition while adding more technical sophistication. Their frontline is particularly impressive, with players capable of creating chances and converting them in the final third. The team will be looking to make a strong start to the tournament and establish themselves as contenders in a competitive group.
Ecuador, on the other hand, has built a reputation for defensive solidity under their current management. La Tri has kept thirteen clean sheets in recent matches, demonstrating their organizational discipline and ability to frustrate opponents. However, facing the quality of Ivory Coast's attack will test their defensive credentials to the fullest. Ecuador will need to balance their defensive responsibilities with the need to pose a threat on the counterattack to secure a positive result.
The tactical battle in this match will be compelling. Ivory Coast will likely look to impose their physicality and attacking intent early, seeking to overwhelm Ecuador's defense through sustained pressure and individual brilliance. Ecuador will aim to remain compact, deny space in dangerous areas, and look for opportunities to strike on the break when Ivory Coast commits players forward.
My prediction for this match is a two to one victory for Ivory Coast. While Ecuador's defensive record is impressive, the sheer quality and firepower of the Ivory Coast attack should eventually prove decisive. The match is likely to be closely contested, with Ecuador making it difficult for the African side, but Ivory Coast's superior individual quality in the attacking third should see them through. The opening goal will be crucial, and if Ivory Coast can score early, they may be able to control the tempo and see out the victory.
For participants in the Gate World Cup Prediction Campaign, today's matches offer excellent opportunities to demonstrate analytical skills and potentially earn rewards. When making predictions, consider factors such as team form, head to head records, injury updates, tactical matchups, and historical performance in major tournaments. Successful prediction requires balancing statistical analysis with an understanding of the intangible factors that can influence match outcomes, such as motivation, pressure, and the unique circumstances of World Cup football.
The Gate World Cup Prediction Campaign represents an excellent opportunity for football fans to engage more deeply with the tournament while potentially earning substantial rewards. By combining passion for football with analytical thinking and community engagement, participants can enhance their World Cup experience while competing for prizes. Whether you are an experienced football analyst or a casual fan, the campaign welcomes all levels of expertise and provides a platform for sharing insights and learning from others.
As the tournament progresses, the matches will become increasingly intense, with more at stake in each fixture. The group stage will determine which teams advance to the knockout rounds, where a single moment can decide a team's fate. The World Cup has a history of producing unforgettable moments, unexpected results, and individual brilliance that captures the imagination of fans worldwide. This edition, with its expanded format and three nation hosting arrangement, promises to be one of the most memorable tournaments in history.
@Gate_Square
repost-content-media
  • Reward
  • Comment
  • Repost
  • Share
#PredictWorldCup🇩🇪vs🇨🇼
Germany vs Curacao World Cup 2026 Match Analysis and Prediction
This is a truly historic encounter in the FIFA World Cup 2026, taking place today at Houston Stadium in Texas. The match represents one of the most significant David versus Goliath stories in World Cup history, with four-time world champions Germany facing tournament debutants Curacao.
The Historical Context
Germany enters this match as one of the most decorated nations in football history, having won the World Cup four times and reaching the final on four additional occasions. Their pedigree speaks for
HighAmbition
#PredictWorldCup🇩🇪vs🇨🇼
Germany vs Curacao World Cup 2026 Match Analysis and Prediction
This is a truly historic encounter in the FIFA World Cup 2026, taking place today at Houston Stadium in Texas. The match represents one of the most significant David versus Goliath stories in World Cup history, with four-time world champions Germany facing tournament debutants Curacao.
The Historical Context
Germany enters this match as one of the most decorated nations in football history, having won the World Cup four times and reaching the final on four additional occasions. Their pedigree speaks for itself, with a rich tradition of producing world-class talent and playing an attractive, attacking brand of football. Under Julian Nagelsmann, Germany has been rebuilding after disappointing early exits in recent tournaments, and they arrive at this World Cup with genuine ambitions of reclaiming their place at the summit of world football.
Curacao, on the other hand, is making history simply by being here. This tiny Caribbean island nation with a population of just 150,000 people has become the smallest country ever to qualify for a FIFA World Cup. Their journey to this point is nothing short of remarkable, defying every expectation and overcoming obstacles that would have seemed insurmountable just a few years ago. For Curacao, this match is not just about the result; it is about representing their nation on the grandest stage in sports and showing the world what they are capable of achieving.
Team Analysis: Germany
Julian Nagelsmann has assembled a squad that blends experience with exciting young talent. The decision to bring Manuel Neuer out of international retirement has raised eyebrows, but the 40-year-old goalkeeper remains a towering presence and a leader in the dressing room. His experience and commanding presence could prove invaluable in a tournament environment.
In defense, Germany has solid options with Joshua Kimmich, Jonathan Tah, and Nico Schlotterbeck forming the backbone. Nathaniel Brown from Eintracht Frankfurt appears to have won the battle for the left-back position ahead of David Raum, showcasing Nagelsmann's willingness to give opportunities to emerging talent.
The midfield is where Germany truly shines. Jamal Musiala and Florian Wirtz represent the future of German football, two generational talents who can unlock any defense with their creativity and technical ability. Leroy Sane has been given another chance on the international stage despite a mixed season at club level, and his pace and directness could be crucial against a Curacao side that will likely sit deep. Kai Havertz is expected to lead the line, bringing his Champions League-winning experience and intelligent movement to the attack.
Germany's recent form has been encouraging. They have won nine consecutive international matches, including a 2-1 victory over the United States in their final warm-up fixture. Their 6-0 demolition of Slovakia in a competitive match demonstrates their ability to put weaker opposition to the sword, which is exactly what they will need to do today.
Team Analysis: Curacao
Curacao's story is one of the most fascinating in this World Cup. The vast majority of their squad is composed of players from the Dutch diaspora, born and raised in the Netherlands but choosing to represent the island of their families' origin. Players like Tahith Chong, who came through the Manchester United academy, and Jurgen Locadia, who played for PSV Eindhoven and Brighton, bring valuable experience from top European leagues.
Under the guidance of Dick Advocaat, the 78-year-old Dutch coach who will become the oldest head coach in World Cup history, Curacao has developed a pragmatic approach. Advocaat is a seasoned campaigner who understands how to organize a team and make life difficult for superior opponents. His message to his players has been clear: be yourselves, do not be nervous, and embrace this historic moment.
Curacao qualified for the World Cup by topping their group in CONCACAF qualifying, demonstrating that they are not merely here to make up the numbers. However, their recent friendly results, including a 4-1 defeat to Scotland, suggest that they will face an enormous challenge against a German side of far superior quality.
Tactical Breakdown
Germany is expected to dominate possession from the first whistle. Nagelsmann's preferred system allows his creative players to interchange positions and find space between the lines. Against a team like Curacao, who will almost certainly defend with numbers behind the ball, Germany will need to be patient and precise in their build-up play.
The key for Germany will be moving the ball quickly and stretching the Curacao defense horizontally. With players like Musiala and Wirtz capable of operating in tight spaces, and Sane providing width on the right, they have the tools to break down even the most stubborn defenses. Set pieces could also be an important avenue, with Germany's height advantage likely to cause problems.
Curacao's approach will be defensive and organized. They will look to stay compact, deny Germany space in central areas, and try to hit on the counter-attack when opportunities arise. The challenge will be maintaining concentration and discipline for ninety minutes against a team that will create numerous chances.
Key Players to Watch
For Germany, Jamal Musiala is the player who can make the difference. His ability to dribble past defenders and create scoring opportunities from nothing makes him a nightmare for any opposition. Florian Wirtz, despite a mixed season at Liverpool, has been in excellent form for Germany and will be looking to make a statement on the world stage. Kai Havertz's movement and finishing will be crucial in converting the chances that Germany creates.
For Curacao, Tahith Chong offers the most threat going forward. His pace and trickery could trouble the German defense if he gets isolated one-on-one. Goalkeeper Eloy Room, who plays alongside Locadia at Miami FC, will likely have a busy afternoon and will need to produce an inspired performance to keep the scoreline respectable.
The Prediction
This match represents one of the biggest mismatches in World Cup history on paper. Germany is ranked among the top nations in the world, while Curacao sits at 82nd in the FIFA rankings, making them the third-lowest ranked team in the tournament.
The betting odds reflect this disparity, with Germany priced at -2000 and Curacao at +3500. The bookmakers expect a comfortable German victory, and it is difficult to argue with that assessment.
Germany's recent 6-0 victory over Slovakia, a team ranked inside the top fifty, suggests they have the capability to score heavily against weaker opposition. Their attacking firepower, combined with Curacao's defensive limitations, points toward a high-scoring game.
My prediction is a comprehensive German victory. I expect Germany to win by a margin of at least five goals, with a final score of 6-0 or 5-0 being the most likely outcome. Germany will want to make a statement in their opening match, and Curacao, despite their best efforts, simply does not have the quality to compete at this level.
The first half may see Curacao show some resistance, but as the game wears on and Germany finds their rhythm, the floodgates are likely to open. Goals from Havertz, Musiala, Wirtz, and Sane are anticipated, with the possibility of multiple players getting on the scoresheet.
My Personal Opinion
From a purely footballing perspective, this match is unlikely to be competitive. However, the beauty of the World Cup is that it brings together nations of all sizes and gives them the opportunity to compete on equal terms. For Curacao, this is a moment of pure pride and joy, regardless of the result.
Germany must approach this match with professionalism and respect. They cannot afford to underestimate their opponents or take their foot off the gas. A convincing victory will build confidence and momentum for the tougher challenges ahead in the tournament.
For football fans, this match offers the chance to witness history. Curacao's first World Cup appearance is a reminder that football is a global game, and that dreams can come true even for the smallest nations. While the result may be predictable, the occasion is anything but ordinary.
I believe Germany will win this match comfortably, and they should use it as an opportunity to fine-tune their attacking patterns and build chemistry among their forward players. The real test for Nagelsmann's side will come in the knockout stages, but a dominant performance today will send a message to the rest of the tournament.
Curacao can hold their heads high regardless of the scoreline. They have already achieved something extraordinary by reaching this point, and their players will remember this day for the rest of their lives. If they can score a goal or even keep the scoreline respectable, it would be considered a moral victory.
In conclusion, Germany is the overwhelming favorite and should secure a comfortable victory. The predicted score is Germany 6-0 Curacao, with Germany dominating possession and creating numerous chances throughout the match. This is their tournament to make a statement, and they should start with a bang.
repost-content-media
  • Reward
  • Comment
  • Repost
  • Share
Futures Return: $200,000 in Rewards – Trade to Claim $5, Compete for a $3,000 Cash Prize https://www.gate.com/campaigns/5116?ref=VLFCVA8MAQ&ref_type=132
IN-4.14%
HighAmbition
Futures Return: $200,000 in Rewards – Trade to Claim $5, Compete for a $3,000 Cash Prize https://www.gate.com/campaigns/5116?ref=VLFCVA8MAQ&ref_type=132
repost-content-media
  • Reward
  • Comment
  • Repost
  • Share
#MyGateTradeStory
Bitcoin Technical Analysis & Trading Strategy
BTC is currently trading around **$64,445**, positioned in a critical zone where multiple technical factors converge. This analysis provides detailed support and resistance levels with actionable trading insights for informed decision-making.
Current Market Structure
Bitcoin has established a trading range between approximately **$62,300 and $64,500**. The price is testing the upper boundary of this range, which represents a key decision point for traders. The current level sits near recent highs and aligns with the upper Bolling
BTC0.39%
HighAmbition
#MyGateTradeStory
Bitcoin Technical Analysis & Trading Strategy
BTC is currently trading around **$64,445**, positioned in a critical zone where multiple technical factors converge. This analysis provides detailed support and resistance levels with actionable trading insights for informed decision-making.
Current Market Structure
Bitcoin has established a trading range between approximately **$62,300 and $64,500**. The price is testing the upper boundary of this range, which represents a key decision point for traders. The current level sits near recent highs and aligns with the upper Bollinger Band, indicating potential resistance pressure.
Key Resistance Levels
**Immediate Resistance: $64,200 - $64,700**
This zone represents the current battleground where sellers are actively defending. A decisive breakout above this level with strong volume could trigger momentum toward higher targets. Traders should watch for sustained closes above $64,500 as confirmation of bullish continuation.
Next Resistance Cluster: $65,200 - $66,000
This area contains overhead EMAs and represents short-term supply where profit-taking typically occurs. Breaking through this cluster would open the path toward the psychological $67,000 level and potentially $68,000-$70,000.
Major Resistance: $68,000 - $70,000
Historical price action shows significant selling pressure in this region. A clean breakout above $70,000 would signal a potential trend reversal with targets extending toward $72,000-$75,000.
Critical Support Levels
Immediate Support: $63,200 - $63,700
This zone aligns with recent consolidation areas and the weekly open. Holding above this level maintains the bullish structure and provides a foundation for potential upside moves.
Strong Support: $62,300 - $62,800
This represents a demand zone where buyers have previously stepped in. A bounce from this area with bullish reversal candles would present favorable long entry opportunities.
Deep Support: $61,000 - $62,000
Breaking below this psychological floor would shift market sentiment bearish, with potential downside extension toward $59,000-$60,000. This level acts as a safety net for the current structure.
Trading Strategy Recommendations
Bullish Scenario Strategy
If BTC holds above $63,200 and shows bullish reversal patterns, consider long positions with the following parameters:
Entry Zone: $62,800 - $63,500 on confirmed bullish candles
Initial Target: $64,200 - $64,500
Extended Target: $65,200 - $66,000
Stop Loss: Below $62,200
Look for confirmation signals including bullish engulfing patterns, pin bars, or morning star formations on hourly and four-hour timeframes. Volume expansion during the bounce adds conviction to the setup.
Bearish Scenario Strategy
If BTC rejects from $64,500 and forms bearish reversal patterns, consider short positions:
Entry Zone: $64,200 - $64,500 on rejection candles
Initial Target: $63,200 - $63,500
Extended Target: $62,300 - $62,800
Stop Loss: Above $65,000
Bearish signals include shooting stars, bearish engulfing patterns, or breakdowns below rising trendlines with increased selling volume.
Risk Management Guidelines
Position sizing remains crucial for sustainable trading. Consider allocating only 2-3 percent of capital per trade to manage downside exposure effectively. Use stop losses religiously and avoid moving them against your position once established.
Wait for clear confirmation before entering trades. Avoid chasing prices during volatile spikes. Patience in letting setups develop according to your plan typically yields better results than impulsive entries.
Monitor macroeconomic events and Bitcoin-specific news that could trigger sudden volatility. ETF flows, regulatory developments, and large institutional movements can rapidly shift market sentiment.
Short-Term Outlook
The current price action suggests a consolidation phase within the $62,000-$65,000 range. The direction of the breakout from this range will likely determine the next significant move. A sustained break above $64,700 targets $66,000+ while failure to hold $63,200 risks a retest of $61,000-$62,000.
Technical indicators show mixed signals with MACD and RSI indicating momentum building but approaching overbought conditions on shorter timeframes. This suggests caution and the importance of waiting for confirmation rather than anticipating moves.
Traders should remain flexible and ready to adapt as price action unfolds. The current environment rewards disciplined execution of predefined strategies rather than emotional reactions to price fluctuations.
@Gate_Square
repost-content-media
  • Reward
  • Comment
  • Repost
  • Share
#MyGateTradeStory
The Leverage Mirage: When 10x Becomes a Trap
The Hook
Everyone tells you leverage is dangerous. What they do not tell you is that leverage feels like genius when it works. The problem is not the loss. The problem is what the win does to your brain.
The Setup**ll
I had been watching NVDA for months. Not trading it. Just watching. The stock moved from $86 in April to over $200 by October. Every week I told myself I would enter. Every week I found a reason to wait. The chart looked extended. The valuation seemed stretched. Some analyst warned about China risks.
Then came the pu
BTC0.37%
ETH-0.66%
HighAmbition
#MyGateTradeStory
The Leverage Mirage: When 10x Becomes a Trap
The Hook
Everyone tells you leverage is dangerous. What they do not tell you is that leverage feels like genius when it works. The problem is not the loss. The problem is what the win does to your brain.
The Setup**ll
I had been watching NVDA for months. Not trading it. Just watching. The stock moved from $86 in April to over $200 by October. Every week I told myself I would enter. Every week I found a reason to wait. The chart looked extended. The valuation seemed stretched. Some analyst warned about China risks.
Then came the pullback. NVDA dropped from $212 to $185 in three sessions. The financial media called it a correction. The technical analysts pointed to support levels. The options market showed fear. I saw opportunity.
I had $2,000 in my futures account. Not life-changing money. Not even serious money. But enough to matter to me. I had done three trades before this. One small win on BTC. Two losses on ETH. My account sat at $1,850. Down 7.5% overall. Not catastrophic. Just annoying.
The Trade
I entered NVDA long at $187.50. The plan was simple. 5x leverage. Stop loss at $182. Target at $200. Risk $150. Potential reward $625. Clean risk-reward. Technical setup. Logical entry.
The first day NVDA closed at $189. Small green candle. I felt smart. The second day it hit $192. I moved my stop to breakeven. The third day it touched $195. I started calculating my profits. $375 unrealized. Almost 20% account growth in three days.
Then Jensen Huang spoke at a conference. Mentioned something about demand exceeding supply. The stock gapped up to $202 at market open. I was up $725. My account balance showed $2,575. I had turned $1,850 into $2,575 in four trading days.
I did not close the position.
The Shift
This is where the story turns. Not because of the market. Because of me.
I started checking my phone every ten minutes. I joined three NVDA trading groups on Telegram. I followed six new analysts on X. I read every article about AI demand and data center spending. I became an expert in H100 chip supply chains overnight.
The stock moved to $208. My unrealized profit hit $1,025. My account showed $2,875. I started thinking about what I could do with the money. Pay off some debt. Upgrade my laptop. Maybe withdraw half and let the rest run.
I moved my stop loss to $195. Guaranteed profit of $375. Still a great trade. But I could not bring myself to close it. The chart looked parabolic. The momentum felt unstoppable. Every dip was buying opportunity. Every green candle confirmed my genius.
The Framework: The Leverage Mirage
I need to name what happened. The Leverage Mirage. It is the optical illusion created by leveraged profits. When you make 50% on a 5x position, your brain records it as skill. When you make 100% on a 10x position, your brain records it as destiny.
The Leverage Mirage has three stages. First, the Distortion Phase. Your perception of risk changes. Positions that once felt large now feel small. Leverage that once scared you now feels conservative. Your mental account size inflates to match your unrealized profits.
Second, the Identity Phase. You stop being someone who trades. You become a trader. The label attaches itself to your self-concept. Losses become personal failures. Wins become personal victories. The market becomes a scoreboard for your worth.
Third, the Trap Phase. You cannot exit because exiting means the game ends. The trade becomes larger than the profit. It becomes proof. Proof that you belong. Proof that you are different from the retail crowd. Proof that you can beat the market.
The Breakdown*l
NVDA hit $215 on the sixth day. My account showed $3,100. I had nearly doubled my money in six sessions. I started planning my next trade. Maybe add to the position. Maybe find another AI stock. The market was giving out free money and I had finally found the line.
Then the news hit. Regulatory concerns. Export restrictions. Something about China H20 chips. NVDA dropped 6% in premarket. I watched it happen on my phone at 6 AM. The stock opened at $202. My stop loss triggered at $195. The gap down blew through my mental stop before I could react.
I closed at $194.50. The final numbers were brutal. Entry $187.50. Exit $194.50. Profit $350. After fees and funding costs, $320. A 17% account gain. Still a winning trade. Still better than my previous results.
But it felt like a loss. Because in my mind, I had made $1,200. Because I had watched $3,100 evaporate into $2,170. Because the Leverage Mirage had shown me a version of myself that did not exist.
The Aftermath
I did not trade for three weeks. Not because of the money. Because of what I discovered about myself.
I realized that the $320 profit was the only real number. Everything else was fiction. Unrealized gains are not gains. Leveraged profits are not skills. The market does not owe anyone a continuation of momentum.
I went back to my journal. The one I kept sporadically. I found entries from before the trade. I had written about patience. About process over outcome. About not falling in love with positions. I had broken every rule I set for myself.
The Leverage Mirage had made me forget who I was. A beginner with inconsistent results. Someone still learning. Someone who got lucky on a momentum trade and confused luck with edge.
The Correction
I changed three things after that trade.
First, I separated my trading journal from my profit and loss statement. The journal records decisions. The PnL records outcomes. I review the journal weekly. I look at PnL monthly. Decisions matter more than results in the short term.
Second, I implemented a leverage ladder. Maximum 3x for my first ten trades in any new market. Maximum 5x after twenty profitable trades. No exceptions. The Leverage Mirage feeds on high leverage. Starve it.
Third, I created a profit-taking protocol. At 50% of initial target, close 25% of position. At 75% of target, close another 25%. Let the rest run with trailing stop. The protocol removes decision-making at the worst possible time. When I am winning and cannot think straight.
The Reflection
I still watch NVDA. It trades above $230 now. I could have made more by holding. That thought still visits me sometimes. But I have learned to recognize it as the Mirage whispering. The what-if game is how the Mirage keeps you trapped in the past.
The truth is I got lucky. I entered a momentum stock at the right moment. I rode a wave created by AI euphoria and institutional buying. I had no edge. I had timing. Timing is not repeatable. Edge is.
The Leverage Mirage taught me that my biggest risk is not the market. It is the version of me that emerges when trades go well. That version is impulsive, overconfident, and convinced of his own genius. He needs rules because he cannot be trusted.
The Question
Every trader has a Mirage trade. The one that showed you what was possible. The one that changed how you see yourself. The one that almost destroyed you.
Mine was NVDA at 5x leverage. A $320 profit that felt like a $900 loss. A winning trade that taught me more than any losing trade ever could.
What is your Mirage trade? And more importantly, what rules have you built to keep that version of yourself from taking over when the next winning streak begins?
@Gate_Square
repost-content-media
  • Reward
  • Comment
  • Repost
  • Share
#MyGateTradeStory
XAU Gold Market Analysis and Trading Strategy
Dear Traders,
Gold is currently trading around the 4232 level, and the market is at a critical juncture. Let me break down the current situation and what to expect next.
Current Market Situation
Gold has been experiencing a corrective phase after the remarkable rally we witnessed earlier this year. The price has pulled back from the all-time highs near 5598 seen in January 2026, and we are now consolidating in the 4100 to 4300 range. Despite this pullback, gold remains approximately 40 to 41 percent higher compared to June 2024,
XAUUSD0.18%
HighAmbition
#MyGateTradeStory
XAU Gold Market Analysis and Trading Strategy
Dear Traders,
Gold is currently trading around the 4232 level, and the market is at a critical juncture. Let me break down the current situation and what to expect next.
Current Market Situation
Gold has been experiencing a corrective phase after the remarkable rally we witnessed earlier this year. The price has pulled back from the all-time highs near 5598 seen in January 2026, and we are now consolidating in the 4100 to 4300 range. Despite this pullback, gold remains approximately 40 to 41 percent higher compared to June 2024, which confirms that the long-term bullish structure remains intact.
The recent weakness is primarily driven by dollar strength and higher US Treasury yields. However, the fundamental backdrop remains supportive for gold. Geopolitical tensions, economic uncertainty, and the ongoing search for safe-haven assets continue to underpin the precious metal.
Key Support and Resistance Levels
Understanding these levels is crucial for your trading decisions.
Resistance levels to watch are 4220 to 4240 as the first major hurdle, followed by 4250 to 4280. A breakout above 4295 to 4300 would be significant and could open the door for a move toward higher targets. The psychological 4000 level also remains important for market sentiment.
On the support side, immediate floor exists at 4160 to 4180. Below that, 4130 to 4150 becomes critical. If we break below 4130, deeper targets come into play at 4085 to 4100, and potentially 4050 to 4000. The 200-day moving average and the long-term uptrend line from 2024, currently near 3250, remain well below current prices and provide a safety net for the overall bull market.
Trading Strategy and Next Moves
For the coming sessions, here is how to approach this market.
The primary strategy is to sell on rallies toward the 4220 to 4240 zone or 4250 to 4280 area, targeting 4180 or 4160 on the downside. This approach aligns with the current corrective phase and allows you to capitalize on the range-bound behavior.
For bullish setups, consider buying dips only if price holds above 4160 to 4180 and successfully reclaims 4210. In that scenario, targets would be 4246 followed by 4275 to 4285.
A range strategy works well here. Buy near 4160 to 4180 and sell near 4220 to 4250 while price stays within the current channel. This approach suits the consolidation phase we are experiencing.
Risk management is essential. Place stops beyond the next key level. For short positions, stop above 4250. For long positions, stop below 4130. Always act at levels and avoid holding positions through major news events.
Price Forecast
The most likely scenario is continued consolidation or a mild pullback first, followed by a rebound toward 4220 to 4240 if supports hold. A bearish extension could occur if we break below 4130, opening the path to 4050 to 4000. A bullish surprise would involve a strong reclaim of 4210 to 4220, potentially accelerating toward 4280 to 4300.
Looking ahead, analysts project gold could reach 4607 to 4892 by December 2026, with an average around 4750. This suggests that any pullback should be viewed as a buying opportunity within the larger uptrend.
Final Thoughts
Gold remains in a structural bull market despite the near-term correction. The key is to respect the levels and trade what you see, not what you hope for. Patience will be rewarded as the market digests the recent moves and prepares for the next leg higher.
Trade wisely and manage your risk.
@Gate_Square
repost-content-media
  • Reward
  • Comment
  • Repost
  • Share
  • Pinned