#CryptoMarketSeesVolatility
VOLATILITY IS NOT THE PROBLEM. NOT UNDERSTANDING IT IS.
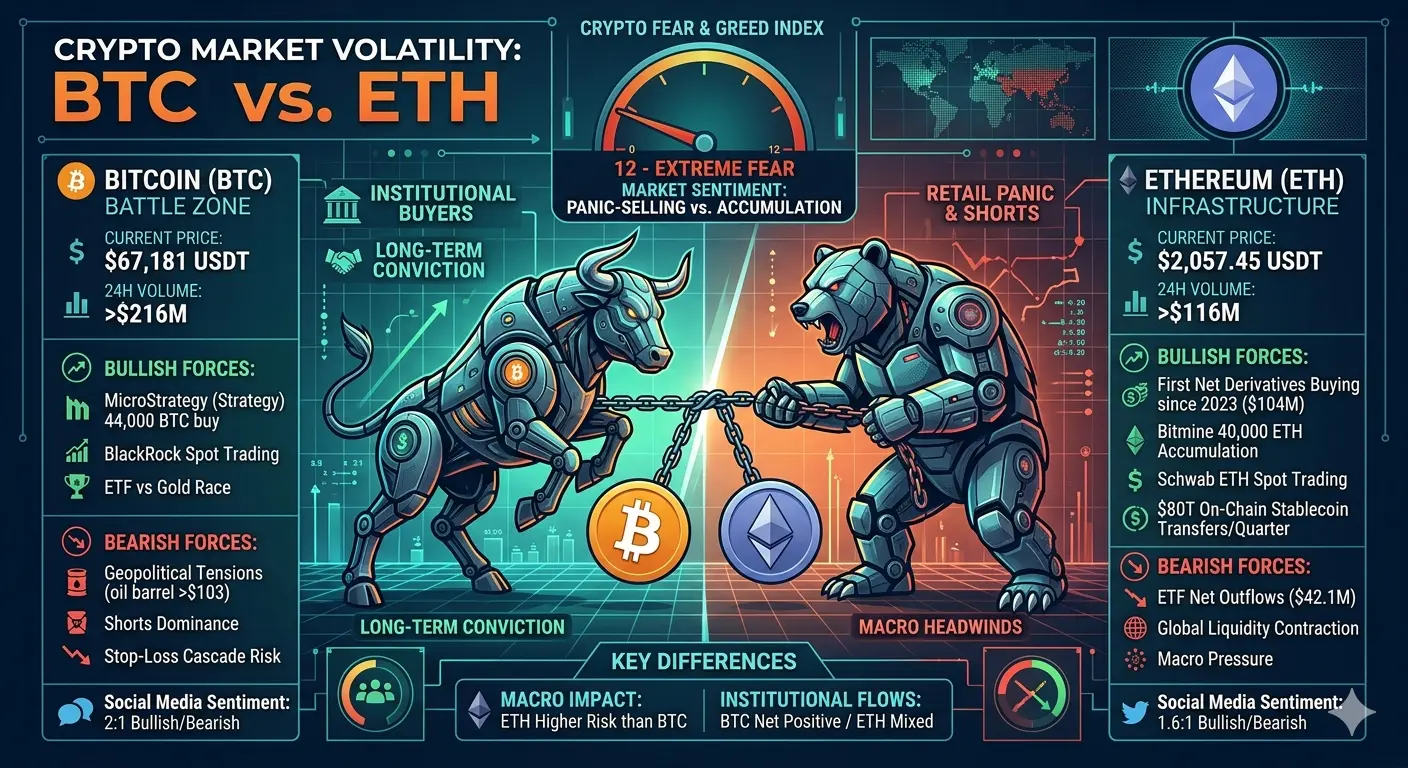
Right now Bitcoin is at $67,081. Ethereum is at $2,052. The fear and greed index is 12 — that is Extreme Fear, and it has been sitting there for weeks. Most people looking at these numbers are asking the wrong question. They are asking "when does it recover?" The better question — the one that actually protects your capital and positions you correctly for what comes next — is "what is specifically driving this volatility, and what would have to change for it to stop?"
This post answers that question with data. Not vibes. Not predictions. Data.
The Sentiment Picture Is At A Multi-Week Extreme
Santiment published data today showing that bearish social media chatter around Bitcoin has reached its highest level in five weeks. Their exact words: "FUD has crept back in with the community showing a key lack of optimism." Here is the part most people skip over when they read that headline — Santiment also noted that this level of community pessimism is "usually a common ingredient for prices rebounding." That is not a contradiction. It is how sentiment cycles work. Maximum bearishness does not mean the price goes lower forever. It means the people most likely to sell have already sold, and the remaining holders are the ones with actual conviction. The ratio of bullish to bearish voices on Bitcoin right now is roughly 2:1 — 82 bullish accounts tracked versus 40 bearish, out of 142 active voices. That 2:1 ratio at a fear index of 12 tells you the bulls have not been completely washed out. They are just quiet.
The On-Chain Data Tells A Specific Story
Glassnode data published this week showed that Bitcoin holders in the 100 to 1,000 BTC range — what analysts call "sharks" — and holders in the 1,000 to 10,000 BTC range — the "whales" — have been realizing average daily losses of approximately $188.5 million and $147.5 million respectively. Combined, that is roughly $337 million in realized losses per day from large holders alone. Cumulative realized losses for the year have already hit $30.9 billion — approaching the levels seen during the 2022 bear market bottom.
CryptoQuant's five-data-source analysis published this week reached the same conclusion from multiple angles: Bitcoin demand is contracting at negative 63,000 BTC per month. Large holders have distributed nearly 188,000 BTC over the past year. The Coinbase premium is negative. Mid-sized holder growth is running at 429,000 BTC versus approximately 1 million in late 2025. The market, in CoinDesk's phrasing, is "thinning from the inside" — the structural demand base is narrowing even as institutional names continue buying in public.
In the past 24 hours alone, Coinglass data shows $59.82 million in total liquidations across the market. Short liquidations accounted for $38.93 million versus $20.89 million in long liquidations — meaning the market caught more shorts off-guard than longs in the most recent session, which is a micro-signal worth watching. When short liquidations begin consistently exceeding long liquidations during a period of maximum fear, it is an early indication that the directional pressure is beginning to shift.
The Macro Drivers Are Not Going Away Overnight
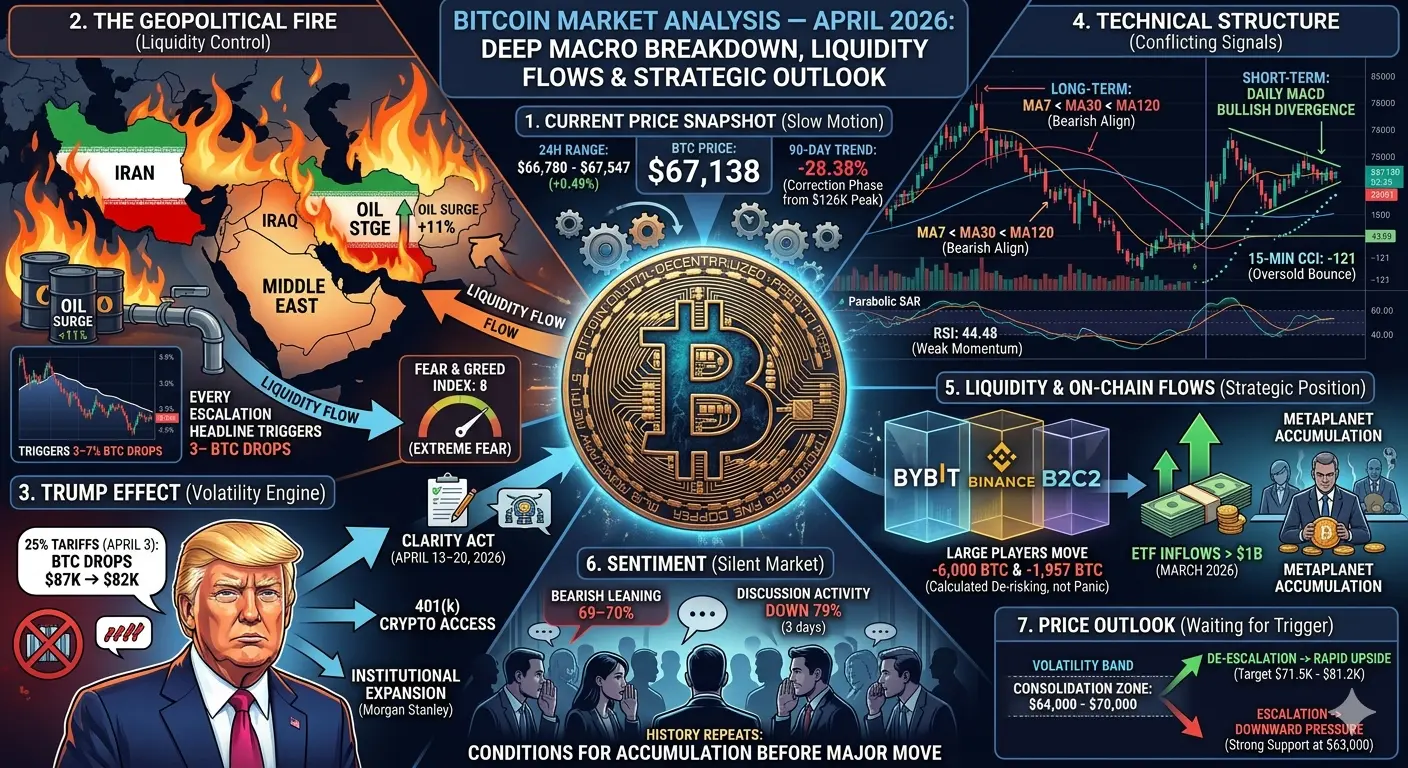
Everything happening on-chain is happening inside a macro environment that is genuinely hostile to risk assets right now. The Iran situation remains active and unresolved — Trump has signaled continued military operations while Iran has been in diplomatic talks with Oman over Hormuz traffic management. WTI crude oil has been trading between $110 and $115 per barrel in volatile sessions this week. JPMorgan told CNBC that Iran's maximum economic leverage on global markets would be felt within weeks as the oil shock works through supply chains. Larry Fink said $150 oil means 100% recession probability. The Federal Reserve cannot cut rates into an oil-driven inflation environment without risking overheating. Bitcoin needs global liquidity expansion for a sustained price recovery. Global liquidity remains constrained as long as oil is elevated and the Fed is paralyzed between its two mandates.
Add to that the Drift Protocol exploit — $200 to $285 million drained from a Solana-based derivatives platform in a pre-planned attack with an eight-day preparation window — and the Google quantum computing paper establishing a 2029 deadline for Bitcoin's cryptographic migration. Neither of these is an immediate existential threat to Bitcoin. Both of them add uncertainty premium to positions and contribute to the sustained elevated fear reading that has defined this entire quarter.
What The Structural Support Actually Looks Like
Here is the honest version of where the floor sits. Bitcoin's 200-week moving average is at $59,268. The realized price — the average cost basis of every Bitcoin holder on-chain — is at $54,177. Both levels have held through all of Q1 2026. Some analysts are calling for a potential bottom zone between $40,000 and $50,000 under a severe scenario where ETF outflows accelerate and leverage fully unwinds. That scenario is plausible but requires a sequence of simultaneous failures — oil continuing toward $150, institutional outflows reversing, and leveraged liquidations cascading through multiple sessions — that has not yet materialized.
What has materialized on the other side of the ledger: ETH derivatives recorded their first net positive buy pressure since the 2023 bear market bottom this week — $104 million in net buying. Strategy is buying 44,000 BTC per month regardless of price. Bitmine added 40,000 ETH to its balance sheet this week at current prices. The halving cycle historically points toward recovery in the 12 to 18 months following the April 2024 halving event — which puts the structural window somewhere between mid and late 2026. Long-term holders are still realizing losses at approximately $200 million per day, which sounds bearish until you recognize that in every prior cycle, the point of maximum long-term holder pain has preceded the recovery by approximately one to two quarters.
The One Thing Volatility Always Rewards
Volatility rewards the people who understand it more than the people who fear it. The traders who panic-sold Bitcoin in November 2018 when every data point looked as bad as it does today missed the entire 2019 to 2021 cycle. The ones who held through the fear index readings in the single digits in 2022 were positioned for the recovery into 2024. That is not a guarantee that history repeats identically. It is an observation that the psychological conditions required to shake out weak hands — maximum FUD, sustained fear readings, bearish social media chatter at multi-week highs, whale distribution — have historically coincided more closely with bottoms than with the continuation of downward moves.
The volatility you are watching right now is not chaos. Every movement has a named cause, a documented data source, and a knowable threshold at which it resolves. The Iran situation resolves when Hormuz fully reopens and oil falls below $90. The leverage overhang resolves when open interest returns to neutral and funding rates stabilize. The on-chain distribution pressure resolves when realized losses approach the exhaustion levels seen in prior cycles. None of those thresholds have been reached yet. All of them are visible and measurable in real time.
Watch the thresholds. Not the candles.
#CryptoMarketSeesVolatility #Gate广场四月发帖挑战 #GateSquare
VOLATILITY IS NOT THE PROBLEM. NOT UNDERSTANDING IT IS.
Right now Bitcoin is at $67,081. Ethereum is at $2,052. The fear and greed index is 12 — that is Extreme Fear, and it has been sitting there for weeks. Most people looking at these numbers are asking the wrong question. They are asking "when does it recover?" The better question — the one that actually protects your capital and positions you correctly for what comes next — is "what is specifically driving this volatility, and what would have to change for it to stop?"
This post answers that question with data. Not vibes. Not predictions. Data.
The Sentiment Picture Is At A Multi-Week Extreme
Santiment published data today showing that bearish social media chatter around Bitcoin has reached its highest level in five weeks. Their exact words: "FUD has crept back in with the community showing a key lack of optimism." Here is the part most people skip over when they read that headline — Santiment also noted that this level of community pessimism is "usually a common ingredient for prices rebounding." That is not a contradiction. It is how sentiment cycles work. Maximum bearishness does not mean the price goes lower forever. It means the people most likely to sell have already sold, and the remaining holders are the ones with actual conviction. The ratio of bullish to bearish voices on Bitcoin right now is roughly 2:1 — 82 bullish accounts tracked versus 40 bearish, out of 142 active voices. That 2:1 ratio at a fear index of 12 tells you the bulls have not been completely washed out. They are just quiet.
The On-Chain Data Tells A Specific Story
Glassnode data published this week showed that Bitcoin holders in the 100 to 1,000 BTC range — what analysts call "sharks" — and holders in the 1,000 to 10,000 BTC range — the "whales" — have been realizing average daily losses of approximately $188.5 million and $147.5 million respectively. Combined, that is roughly $337 million in realized losses per day from large holders alone. Cumulative realized losses for the year have already hit $30.9 billion — approaching the levels seen during the 2022 bear market bottom.
CryptoQuant's five-data-source analysis published this week reached the same conclusion from multiple angles: Bitcoin demand is contracting at negative 63,000 BTC per month. Large holders have distributed nearly 188,000 BTC over the past year. The Coinbase premium is negative. Mid-sized holder growth is running at 429,000 BTC versus approximately 1 million in late 2025. The market, in CoinDesk's phrasing, is "thinning from the inside" — the structural demand base is narrowing even as institutional names continue buying in public.
In the past 24 hours alone, Coinglass data shows $59.82 million in total liquidations across the market. Short liquidations accounted for $38.93 million versus $20.89 million in long liquidations — meaning the market caught more shorts off-guard than longs in the most recent session, which is a micro-signal worth watching. When short liquidations begin consistently exceeding long liquidations during a period of maximum fear, it is an early indication that the directional pressure is beginning to shift.
The Macro Drivers Are Not Going Away Overnight
Everything happening on-chain is happening inside a macro environment that is genuinely hostile to risk assets right now. The Iran situation remains active and unresolved — Trump has signaled continued military operations while Iran has been in diplomatic talks with Oman over Hormuz traffic management. WTI crude oil has been trading between $110 and $115 per barrel in volatile sessions this week. JPMorgan told CNBC that Iran's maximum economic leverage on global markets would be felt within weeks as the oil shock works through supply chains. Larry Fink said $150 oil means 100% recession probability. The Federal Reserve cannot cut rates into an oil-driven inflation environment without risking overheating. Bitcoin needs global liquidity expansion for a sustained price recovery. Global liquidity remains constrained as long as oil is elevated and the Fed is paralyzed between its two mandates.
Add to that the Drift Protocol exploit — $200 to $285 million drained from a Solana-based derivatives platform in a pre-planned attack with an eight-day preparation window — and the Google quantum computing paper establishing a 2029 deadline for Bitcoin's cryptographic migration. Neither of these is an immediate existential threat to Bitcoin. Both of them add uncertainty premium to positions and contribute to the sustained elevated fear reading that has defined this entire quarter.
What The Structural Support Actually Looks Like
Here is the honest version of where the floor sits. Bitcoin's 200-week moving average is at $59,268. The realized price — the average cost basis of every Bitcoin holder on-chain — is at $54,177. Both levels have held through all of Q1 2026. Some analysts are calling for a potential bottom zone between $40,000 and $50,000 under a severe scenario where ETF outflows accelerate and leverage fully unwinds. That scenario is plausible but requires a sequence of simultaneous failures — oil continuing toward $150, institutional outflows reversing, and leveraged liquidations cascading through multiple sessions — that has not yet materialized.
What has materialized on the other side of the ledger: ETH derivatives recorded their first net positive buy pressure since the 2023 bear market bottom this week — $104 million in net buying. Strategy is buying 44,000 BTC per month regardless of price. Bitmine added 40,000 ETH to its balance sheet this week at current prices. The halving cycle historically points toward recovery in the 12 to 18 months following the April 2024 halving event — which puts the structural window somewhere between mid and late 2026. Long-term holders are still realizing losses at approximately $200 million per day, which sounds bearish until you recognize that in every prior cycle, the point of maximum long-term holder pain has preceded the recovery by approximately one to two quarters.
The One Thing Volatility Always Rewards
Volatility rewards the people who understand it more than the people who fear it. The traders who panic-sold Bitcoin in November 2018 when every data point looked as bad as it does today missed the entire 2019 to 2021 cycle. The ones who held through the fear index readings in the single digits in 2022 were positioned for the recovery into 2024. That is not a guarantee that history repeats identically. It is an observation that the psychological conditions required to shake out weak hands — maximum FUD, sustained fear readings, bearish social media chatter at multi-week highs, whale distribution — have historically coincided more closely with bottoms than with the continuation of downward moves.
The volatility you are watching right now is not chaos. Every movement has a named cause, a documented data source, and a knowable threshold at which it resolves. The Iran situation resolves when Hormuz fully reopens and oil falls below $90. The leverage overhang resolves when open interest returns to neutral and funding rates stabilize. The on-chain distribution pressure resolves when realized losses approach the exhaustion levels seen in prior cycles. None of those thresholds have been reached yet. All of them are visible and measurable in real time.
Watch the thresholds. Not the candles.
#CryptoMarketSeesVolatility #Gate广场四月发帖挑战 #GateSquare